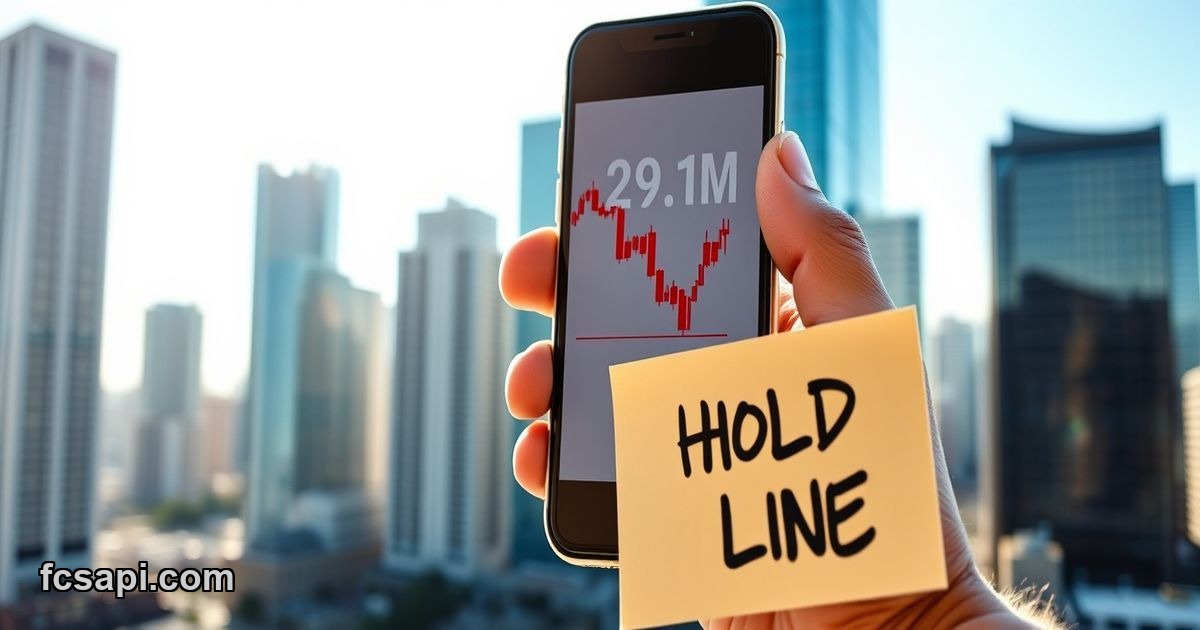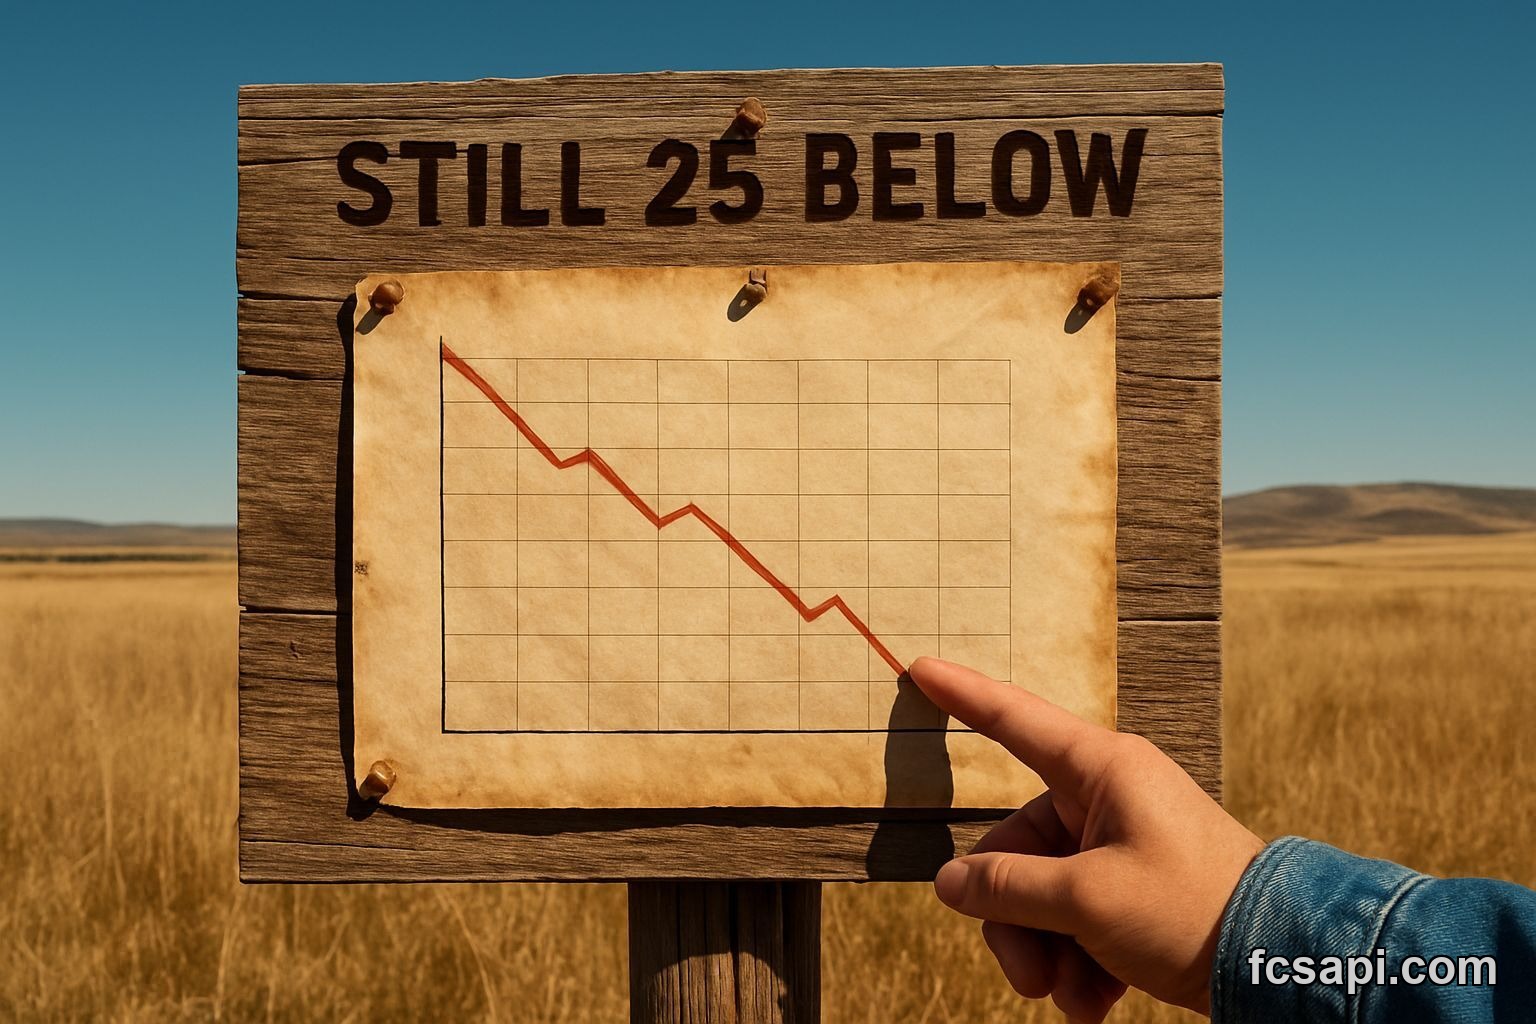
The market cap hit $320.9 billion today. Up 8.3% from open. Everyone's tweeting about the rally. I'm looking at the 200-day exponential moving average sitting at $427 billion and thinking: we're still 25% below where this thing should hold if the trend was intact.
I don't care about one green day. I care about structure. And this structure is broken.
The Signal Score Tells You Everything
Signal score is -38.2. That's a Sell. Not "wait and see", not "monitor closely" — a straight Sell. The algorithm doesn't care about your feelings or the cheerleading on crypto Twitter. It's looking at the whole picture: oscillators, moving averages, momentum, volume patterns.
Here's what jumped out when I pulled the data from FCS API this morning:
- Stochastic K% at 29 — technically a Buy signal in isolation
- RSI at 49.4 — dead neutral, no conviction either way
- SMA 25 at $310.6 billion — we just crossed above it, hence the "Strong Buy" tag
- But the SMA 100 is at $382 billion — Strong Sell
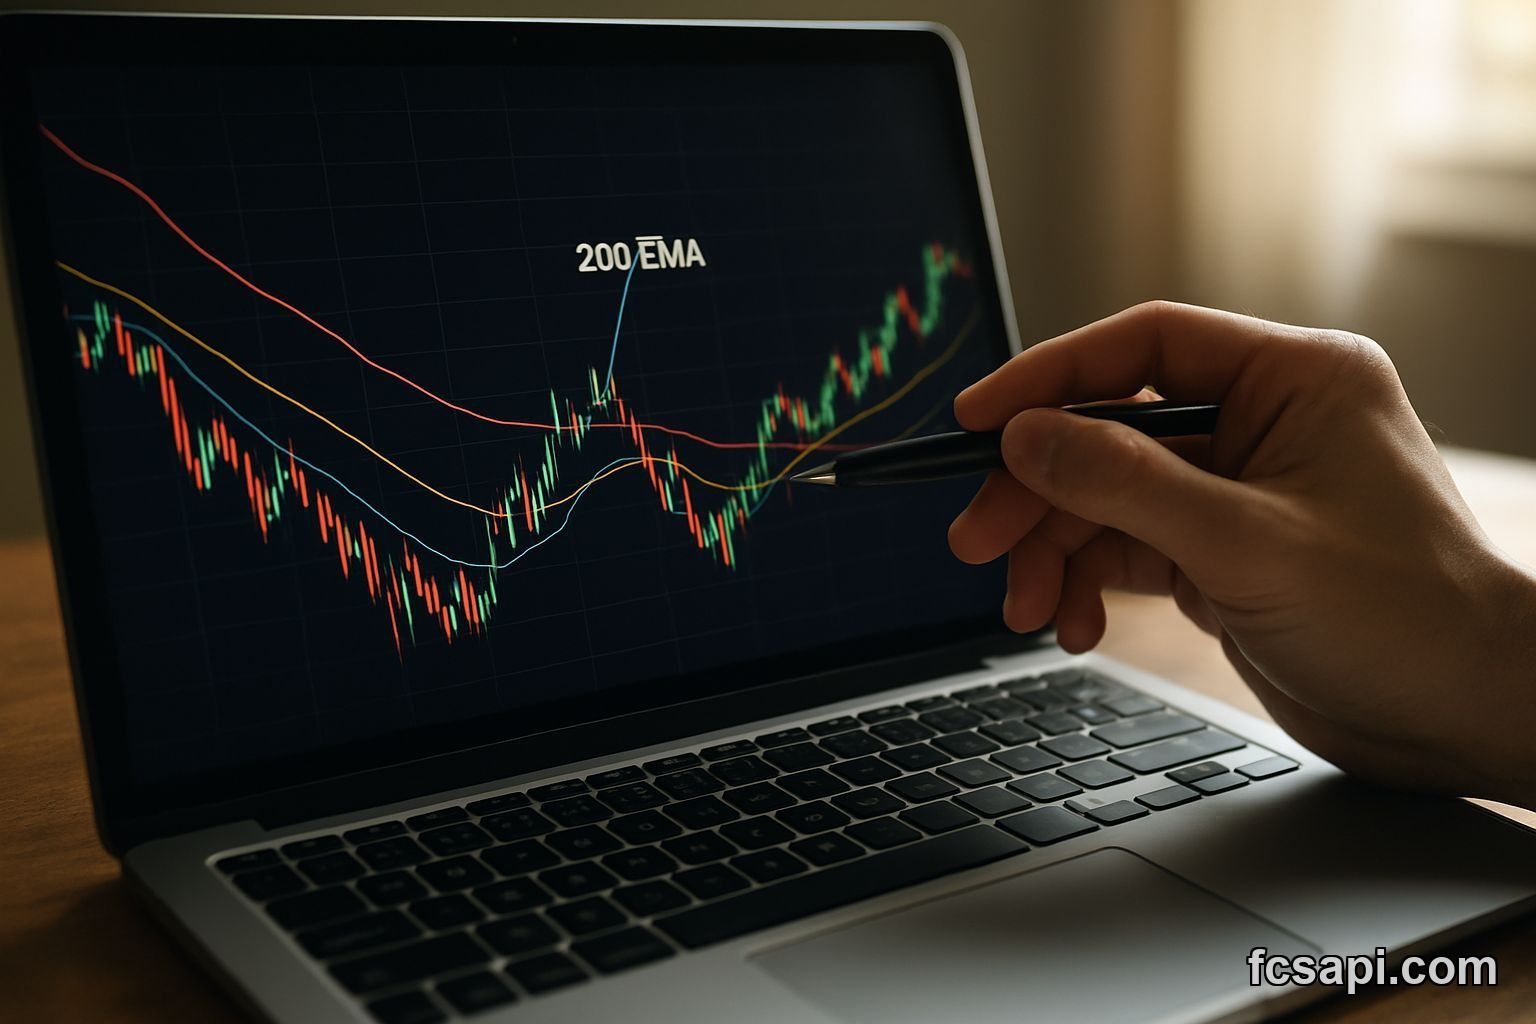
- And that 200 EMA at $427 billion — also Strong Sell
See the problem? Short-term looks fine. Everything else screams trouble.
Six Months of Pain
Performance over the last six months: -44.3%. That's not a correction. That's a wipeout. The all-time high was $648 billion. We're trading at half that level. The all-time low was $261 billion back whenever that happened, and we're only $60 billion above it.
You want to buy this dip? Fine. But understand what you're buying: a market cap that's lost nearly half its value in six months, sitting just 23% above its floor, with every major moving average acting as resistance overhead.
I've seen this movie before. Rally off a low, everyone gets excited, short-term indicators flip bullish, and then.. nothing. The weight of those higher moving averages just crushes it back down.
Bollinger Bands and Fibonacci Say the Same Thing
Bollinger middle band is at $310.6 billion. We're at $320.9 billion. That puts us at the 9.89% position within the bands — basically just barely into the upper half. Normal squeeze, nothing stretched yet. Room to run? Maybe. But probably not far.
Fibonacci pivot points are more interesting:
| Level | Price |
|---|---|
| R1 (Resistance 1) | $298.8 billion |
| Pivot | $295.1 billion |
| S1 (Support 1) | $291.4 billion |
Wait. We opened at $296.1 billion. That was right near the pivot. Now we're at $320.9 billion, which is above the first resistance by a good margin. We've already run past the expected bounce zone. Where's the next resistance? Probably that SMA 100 at $382 billion. That's a 19% move from here. You really think this has that much gas left?
What I'm Watching For
If this rally is real, it needs to hold above $310 billion — that SMA 25 level. Fall back below that and the whole "Strong Buy" narrative falls apart. I'd also want to see RSI push above 55, maybe 60. Right now at 49.4 it's just treading water.
The Stochastic at 29 is interesting. It's in oversold territory giving a Buy signal. But oversold can stay oversold. Especially when the bigger picture is this ugly. I'm not taking that bet.
The Risk Nobody's Talking About
Here's what keeps me up: this asset class is supposed to be about decentralization, global access, permissionless innovation. "Made in America" market cap implies geographic concentration. Regulatory risk, political risk, concentrated custodian risk. One policy change in DC and this whole thing reprices 20% in an afternoon.
You don't see that risk priced in today. Everyone's celebrating the 8.3% pop. Nobody's asking what happens if the regulatory wind shifts. I lived through 2022. I watched things I thought were solid just evaporate because the rules changed overnight. This feels similar.
My Take
I'm not shorting it. But I'm not buying it either. The six-month chart is a disaster, the long-term moving averages are all resistance, and the signal score is -38.2 for a reason. If you want exposure to crypto, there are cleaner setups out there. Check the blog for other ideas or pull live data yourself using the forex API if you want to track this in real time.
One green day doesn't make a trend. And right now, the trend is still down. I'll sit this one out and watch what happens at that $310 billion support over the next few days. If it holds, maybe I revisit. If it breaks, I was right to stay away.
I'm watching from the sidelines. If it reclaims that 200 EMA at $427 billion, call me — but until then, this is a trade I don't need to take.