FCS Advanced Chart Library
FCS Advanced Chart is a lightweight, high-performance charting library for financial markets. Display real-time candlestick, line, and area charts with technical indicators and drawing tools. Designed for forex, crypto, and stock trading platforms with TradingView-like functionality.
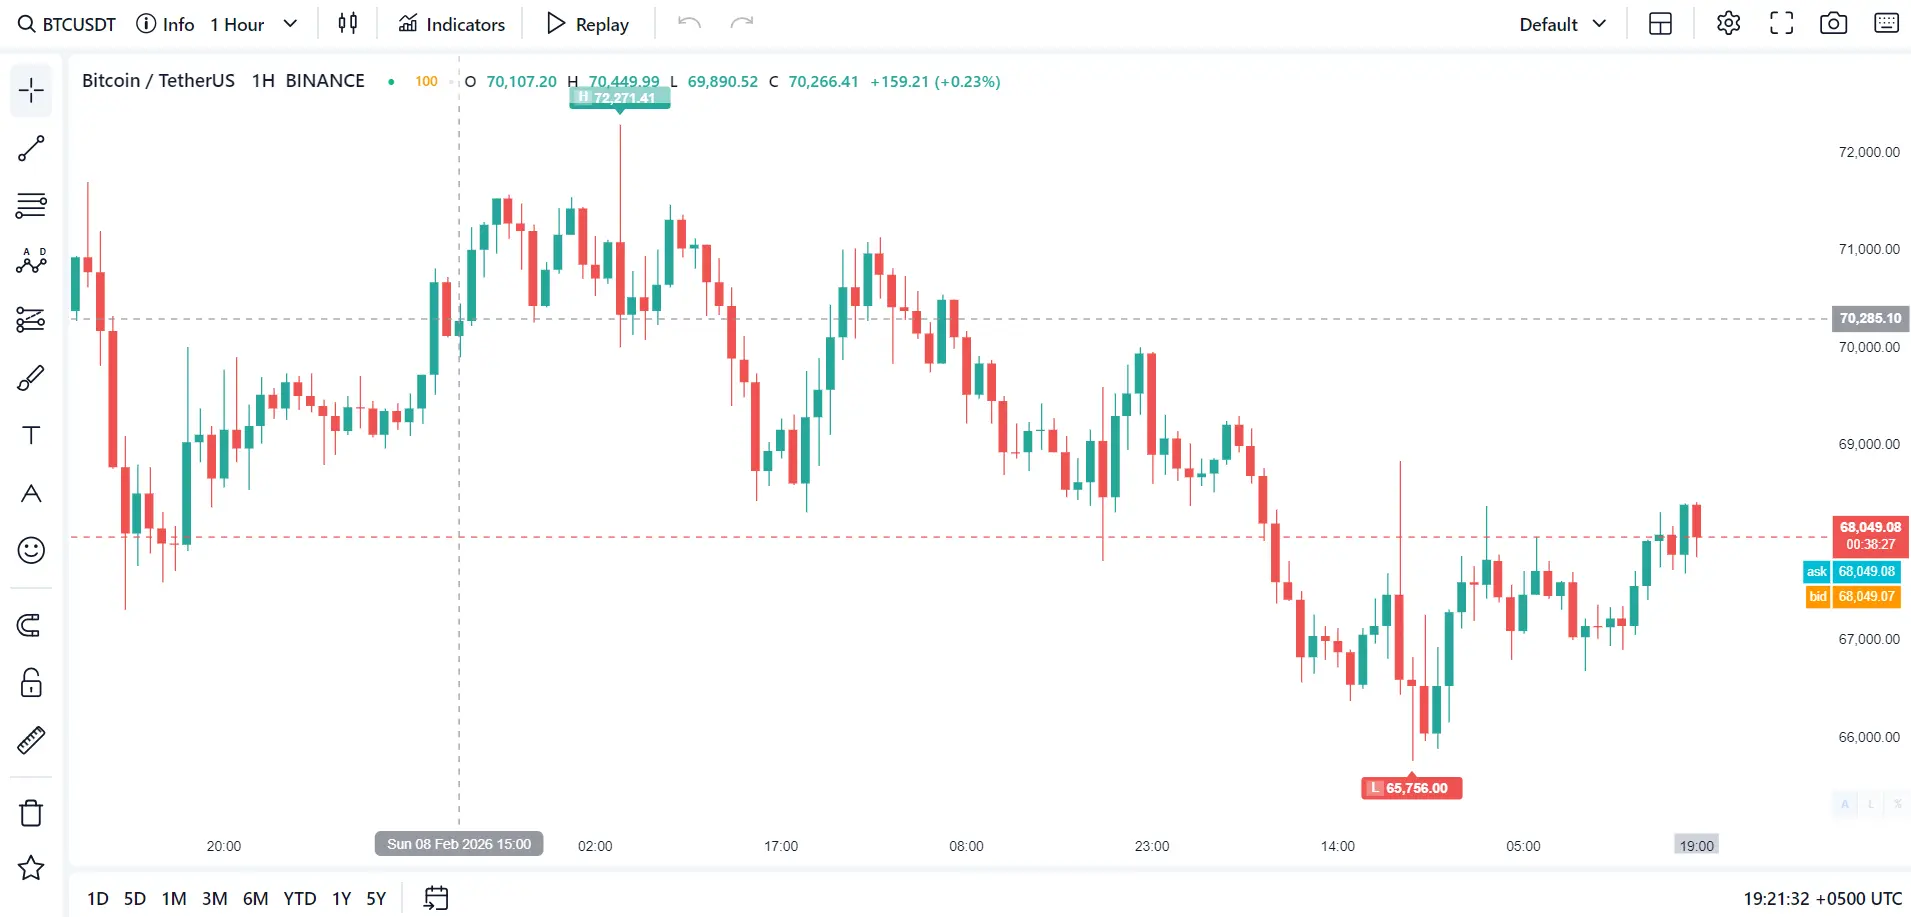
Access KEY, so the chart shows a small Powered by vunelix.com label in the bottom corner. Set your own FCSAPI accessKey and that label is removed automatically - no extra setting needed.Our chart library provides professional-grade charting capabilities with minimal resource usage. Perfect for trading platforms, market analysis tools, and financial dashboards that need real-time data visualization.
• Real-time updates - WebSocket integration for live price data
• Multiple chart types - Candlestick, Bars, Line, Area, Heikin-Ashi, Renko and more
• Technical indicators - 50+ built-in indicators (MA, RSI, MACD, Bollinger Bands, etc.)
• Drawing tools - Trend lines, Fibonacci, patterns, and annotations
• Broker Integration - Horizontal Line API for TP/SL/Entry price lines
• Lightweight - Optimized for low CPU/RAM usage on browsers and mobile
- 9 chart types: Candlestick, Bars, Line, Area, Hollow, Heikin-Ashi, High-Low, Volume Candles, Renko
- 50+ technical indicators with customizable settings
- Drawing tools: Trend lines, Fibonacci, ABCD patterns, annotations
- Multi-timeframe support: 1m, 5m, 15m, 30m, 1H, 4H, 1D, 1W, 1M + custom timeframes
- Horizontal Line API for brokers (TP/SL/Entry price lines)
- Replay mode for backtesting strategies
- Screenshot/export functionality
- Dark and Light themes
- Responsive design for desktop and mobile
Get Started in 3 Steps
Start displaying professional financial charts in minutes. Just include our library, create a container, and initialize the chart.
Step 1: Include the Library
Add the CSS and JavaScript files to your HTML:
<!-- CSS -->
<link rel="stylesheet" href="https://cdn.jsdelivr.net/gh/fcsapi/chart-js/src/fcsapi-chart.css">

<!-- JavaScript -->
<script src="https://cdn.jsdelivr.net/gh/fcsapi/chart-js/src/fcsapi-chart.js"></script>
Step 2: Create Chart Container
Add a container element for the chart:
<div id="fcs_chartparent">
    <div id="fcs_chart"></div>
</div>
Step 3: Initialize the Chart
Create a new chart instance with your configuration:
const chart = new FCSAPIChart({
    container: document.getElementById('fcs_chart'),
    parentid: 'fcs_chartparent',
    accessKey: 'YOUR_API_KEY',
    symbol: 'BINANCE:BTCUSDT',
    period: '1H'
});You need a valid API key to load chart data. Get your API key from your dashboard.
No branding with your own key: the free key (or leaving accessKey empty) draws a small Powered by vunelix.com label on the chart. As soon as you pass your own FCSAPI access key, the label is gone - it is white-label by default.
Library Installation
Download and include the FCS Chart library files in your project. The library consists of a CSS file for styling and a JavaScript file for functionality.
CDN (Recommended)
Include from GitHub CDN - no download required:
<!-- CSS -->
<link rel="stylesheet" href="https://cdn.jsdelivr.net/gh/fcsapi/chart-js/src/fcsapi-chart.css">

<!-- JavaScript -->
<script src="https://cdn.jsdelivr.net/gh/fcsapi/chart-js/src/fcsapi-chart.js"></script>
Container Setup
The chart requires two nested containers:
<div id="fcs_chartparent" style="width: 100%; height: 600px;">
    <div id="fcs_chart"></div>
</div>
Important: The parent container (fcs_chartparent) must have a defined height. The inner container (fcs_chart) will be managed by the chart library.
Mobile Height Fix
For full-height charts on mobile devices, use this JavaScript:
function setMobileHeight() {
    const vh = window.innerHeight;
    document.getElementById('fcs_chartparent').style.height = vh + 'px';
}
setMobileHeight();
window.addEventListener('resize', setMobileHeight);CSS:https://cdn.jsdelivr.net/gh/fcsapi/chart-js/src/fcsapi-chart.css
JavaScript:https://cdn.jsdelivr.net/gh/fcsapi/chart-js/src/fcsapi-chart.js
- Browser: Modern browsers with ES6 support (Chrome, Firefox, Safari, Edge)
- Container: Parent element must have defined width and height
- API Key: Valid FCS API key for data access
- Socket Key: Optional WebSocket key for real-time updates
Chart Configuration Options
Configure your chart with these options. Only container, parentid, and accessKey are required - all other options have sensible defaults.
Required Settings
| Option | Type | Description |
|---|---|---|
container | Element | *required Chart container DOM element |
parentid | String | *required Parent container ID for toolbar/sidebar positioning |
accessKey | String | *required Your FCS API access key |
socketApiKey | String | optional WebSocket API key for live price updates |
publicKey | String | optional Public key used to hide your accessKey from the user's network requests |
socketUrl | String | optional Custom WebSocket server URL (e.g. ws://localhost:4001/ws) |
Core Chart Settings
| Option | Type | Default | Description |
|---|---|---|---|
symbol | String | BINANCE:BTCUSDT | Default symbol to load (format: EXCHANGE:SYMBOL) |
period | String | 1H | Default timeframe: 1m, 5m, 15m, 30m, 1H, 4H, 1D, 1W, 1M |
length | Number | 600 | Number of candles to load (max depends on API plan) |
enableCache | Boolean | true | Cache user's last symbol/period/settings in localStorage |
changeURL | Boolean | true | Update browser URL with symbol/period (shareable links) |
Display Mode
| Option | Type | Default | Description |
|---|---|---|---|
displayMode | String | normal | normal = full UI with toolbar/sidebar | chartonly = hide all UI, show only chart |
Appearance
| Option | Type | Default | Description |
|---|---|---|---|
theme | String | dark | dark | light |
defaultChartType | String | candlestick | candlestick | bars | line | area | hollow | heikin-ashi | high-low | volume-candles |
timezone | String | local | local | UTC | +05:00 | -08:00 etc. |
Symbol Format: Always use EXCHANGE:SYMBOL format (e.g., BINANCE:BTCUSDT, NASDAQ:AAPL, FX:EURUSD)
Performance: Use displayMode: "chartonly" for embedded charts to reduce memory usage
Caching: Enable enableCache to remember user preferences across sessions
Hide Access Key: Set publicKey to keep your accessKey out of the user's network requests
Socket Limits: The default WebSocket key is limited to a 2-second update rate and limited connections per IP. For faster updates and more connections, purchase a dedicated socket key.
UI Layout Toggles
Control which UI elements are visible on your chart. Disable elements you don't need to create a cleaner interface or reduce memory usage.
Main Layout Elements
| Option | Default | Description |
|---|---|---|
enableSidebar | true | Left sidebar with drawing tools (trend lines, fibonacci, shapes, etc.) |
enableToolbar | true | Top toolbar with all controls (search, indicators, settings, etc.) |
enableRangeSelector | true | Bottom time range selector bar for quick navigation |
Toolbar Controls
| Option | Default | Description |
|---|---|---|
enableSearch | true | Symbol search button and search panel |
enableIndicators | true | Indicators button and indicator selection panel |
enableMultiChart | true | Multi-chart layouts button (1/2/3/4 charts) |
enableReplay | true | Replay mode button for backtesting |
enableCapture | true | Screenshot/export button |
enableUndoRedo | true | Undo/Redo buttons (also Ctrl+Z, Ctrl+Y) |
enableTemplates | true | Template save/load functionality |
enableSettings | true | Settings gear button for chart preferences |
enableSymbolInfo | true | Symbol info button (shows profile/stats) |
enableChartTypeSelector | true | Chart type dropdown selector in toolbar |
enableTimeframeSelector | true | Timeframe/period dropdown selector in toolbar |
displayExchangeName | true | Show the exchange name in the info overlay; set false to hide it |
For an embedded chart without UI controls, use:displayMode: "chartonly"
Or disable individual elements:enableSidebar: false,
enableToolbar: false,
enableRangeSelector: false
Symbol Search Filters
Control which tabs and symbols appear in the symbol search modal. Use these options to limit the search to specific asset classes or a curated list of symbols.
Example 1: I want to display only Commodity symbols hide all other stocks forex. use `searchModalTabs`
Example 2: I want only Major currencies and Few stocks. use `searchAllowSymbols`
Search Filter Options
| Option | Type | Default | Description |
|---|---|---|---|
searchModalTabs | Object | null | Only show these tabs in the search modal (null = show all). Keys map to a display label. |
searchAllowSymbols | Array | null | Only these symbols appear in search results (null = all allowed) |
searchExcludeSymbols | Array | null | Hide these symbols from search results (null = none hidden) |
Available Tab Keys
Use these keys in searchModalTabs to control which category tabs are shown:
| Key | Category |
|---|---|
fav | Favorites |
all | All List |
forex | Forex |
crypto | Crypto |
commodity | Commodity |
stock | Stocks |
dr | Depositary Receipts |
fund | Funds |
futures | Futures |
indices | Indices |
dex | Dex |
Usage
const chart = new FCSAPIChart({
    container: document.getElementById('fcs_chart'),
    parentid: 'fcs_chartparent',
    accessKey: 'YOUR_KEY',

    // Only show these tabs (key: label)
    searchModalTabs: {
        'fav': 'Fav',
        'all': 'All List',
        'forex': 'Forex',
        'crypto': 'Crypto',
        'stock': 'Stocks'
    },

    // Only allow these symbols (null = all)
    searchAllowSymbols: ['BINANCE:BTCUSDT', 'ONA:EURUSD'],

    // Hide these symbols (null = none)
    searchExcludeSymbols: ['BINANCE:DOGEUSDT']
});Whitelist Mode: Set searchAllowSymbols to a fixed list to expose only the symbols you support
Blacklist Mode: Use searchExcludeSymbols to hide specific symbols while keeping everything else
Tabs: Omit searchModalTabs (or set null) to show every category tab
Chart Features Configuration
Enable or disable specific chart features like real-time updates, drawing tools, grid lines, and price labels.
Core Features
| Option | Default | Description |
|---|---|---|
enableSocket | true | WebSocket for live price updates (requires socketApiKey) |
enableContextMenu | true | Right-click context menu on chart |
enableDrawingTools | true | Enable drawing tools functionality |
Grid & Crosshair
| Option | Default | Description |
|---|---|---|
enableGrid | false | Show grid lines on chart background |
enableCrosshair | true | Show crosshair on mouse hover |
enableCrosshairLabels | true | Show price/time labels on crosshair axes |
Price Labels & Lines
| Option | Default | Description |
|---|---|---|
enablePriceLine | true | Current price horizontal line and label |
enableAskBidLines | false | Ask/Bid price lines (requires socket connection) |
enableAskPriceLabels | true | Ask price label on price axis |
enableBidPriceLabels | true | Bid price label on price axis |
enableHighLowLabels | true | High/Low price labels on visible chart area |
Indicator Settings
| Option | Default | Description |
|---|---|---|
enableIndicatorLabels | true | Show indicator name labels on chart panels |
enableOHLCBar | true | Show OHLC values bar in top-left corner |
indicatorPanelBgColor | null | Panel background color (null = use theme background) |
Scale Settings
| Option | Default | Description |
|---|---|---|
autoScale | true | Auto-scale price vertical axis to visible data |
logScale | false | Use logarithmic price scale |
Drawing Settings
| Option | Default | Description |
|---|---|---|
defaultMagnetMode | false | Snap drawing points to candle OHLC values |
Customize price label colors with hex values:askLabelColor: "#00bcd4" (cyan)bidLabelColor: "#ff9800" (orange)lastPriceLabelColor: null (uses candle up/down color)
Chart API Methods
Control your chart programmatically using these API methods. Change symbols, timeframes, themes, and more at runtime.
Symbol & Period
// Change symbol
chart.setSymbol('NASDAQ:AAPL');

// Change timeframe
chart.setPeriod('4H');

// Both at once
chart.setSymbol('BINANCE:ETHUSDT');
chart.setPeriod('1D');
Theme & Chart Type
// Switch theme
chart.setTheme('light');  // 'dark' | 'light'

// Change chart type
chart.setChartType('line');
// Options: candlestick, bars, line, area,
// hollow, heikin-ashi, high-low, volume-candles
Export & Capture
// Get chart as base64 image
const imageData = chart.exportImage();

// Use the image
const img = new Image();
img.src = imageData;
document.body.appendChild(img);

// Or download
const link = document.createElement('a');
link.download = 'chart.png';
link.href = imageData;
link.click();
Resize
// Recalculate dimensions after container resize
chart.resize();

// Example: call after window resize
window.addEventListener('resize', () => {
    chart.resize();
});
Cleanup
// Remove chart and cleanup resources
chart.destroy();

// Important: Call this when removing chart from page
// to prevent memory leaksAccess chart instance in browser console for debugging:console.log(chart.engine.data.length);console.log(chart.engine.socketManager?.getConnectionStatus());
Response Format
Response Fields
setSymbol(symbol)- Change the displayed symbol. Format: EXCHANGE:SYMBOLsetPeriod(period)- Change timeframe. Values: 1m, 5m, 15m, 30m, 1H, 4H, 1D, 1W, 1MsetTheme(theme)- Switch between dark and light themessetChartType(type)- Change chart visualization typeexportImage()- Returns base64-encoded PNG image of the chartresize()- Recalculate chart dimensions after container resizedestroy()- Remove chart and cleanup all event listeners and resources
- Always call
destroy()when removing chart from DOM - Call
resize()after any container size changes - Wait for chart initialization before calling API methods
- Symbol format must include exchange prefix (BINANCE:, NASDAQ:, FX:)
Horizontal Line API (for Brokers)
Programmatically add, update, and remove horizontal price lines on the chart. Perfect for displaying Take Profit (TP), Stop Loss (SL), and Entry price levels for trading orders.
addHorizontalLine(options)
Add a horizontal line at a specific price. Returns a Promise with the line ID:
// Add Take Profit line (async/await)
const tpLine = await chart.addHorizontalLine({
    price: 45000,
    color: '#00ff00',
    label: 'TP',
    style: 'dashed'
});

// Add Stop Loss line (Promise.then)
chart.addHorizontalLine({
    price: 42000,
    color: '#ff0000',
    label: 'SL',
    style: 'dashed'
}).then(slLine => {
    console.log('SL Line ID:', slLine);
});

// Add Entry line with all options
const entryLine = await chart.addHorizontalLine({
    price: 43500,
    color: '#2196f3',
    label: 'Entry',
    style: 'solid',        // 'solid' | 'dashed'
    lineWidth: 2,
    textPosition: 'above-left',
    textColor: '#ffffff',
    textSize: 12,
    id: 'my-entry-line'    // Optional custom ID
});
Line Options
| Option | Type | Default | Description |
|---|---|---|---|
price | Number | * required | Price level for the line |
color | String | #ff6d00 | Line color (hex) |
label | String | '' | Text label (TP, SL, Entry) |
style | String | solid | 'solid' or 'dashed' |
lineWidth | Number | 2 | Line thickness in pixels |
textPosition | String | above-center | above-left, above-center, above-right, below-left, below-center, below-right |
textColor | String | #ffffff | Label text color |
textSize | Number | 12 | Label font size |
id | String | auto | Custom ID (auto-generated if not provided) |
updateHorizontalLine(lineId, options)
Update an existing line (e.g., when user drags an order):
// Move TP line to new price
chart.updateHorizontalLine(tpLine, { price: 46000 });

// Change color and label
chart.updateHorizontalLine(slLine, {
    price: 41500,
    color: '#ff5722',
    label: 'SL (adjusted)'
});
removeHorizontalLine(lineId)
Remove a line (when order is filled/cancelled):
// Remove single line
chart.removeHorizontalLine(tpLine);

// Remove by custom ID
chart.removeHorizontalLine('my-entry-line');
getHorizontalLines()
Get all programmatic lines:
const lines = chart.getHorizontalLines();
console.log(lines);
// [{id: 'abc', price: 45000, color: '#00ff00', label: 'TP', ...}, ...]
clearHorizontalLines()
Remove all programmatic lines:
const count = chart.clearHorizontalLines();
console.log('Removed', count, 'lines');Trading Platforms: Display pending orders on chart
Order Management: Show TP/SL levels for open positions
Alerts: Visualize price alert levels
Analysis: Mark important support/resistance levels
Response Format
Response Fields
addHorizontalLine(options)- Add a horizontal line, returns Promise with line IDupdateHorizontalLine(id, options)- Update an existing line's propertiesremoveHorizontalLine(id)- Remove a specific line by IDgetHorizontalLines()- Get array of all programmatic linesclearHorizontalLines()- Remove all programmatic lines, returns count
- Use custom IDs to easily track and update order lines
- Use green (#00ff00) for TP, red (#ff0000) for SL, blue (#2196f3) for Entry
- Use dashed style for pending orders, solid for filled orders
- Remove lines when orders are cancelled or filled
- Update line price when order is modified
Available Chart Types
FCS Chart supports 9 different chart visualization types. Each type offers a different way to view price data, suitable for different analysis needs.
Chart Types
| Type | Value | Description |
|---|---|---|
| Candlestick | candlestick | Traditional Japanese candlesticks showing OHLC with colored bodies |
| Bars (OHLC) | bars | OHLC bars with horizontal ticks for open/close |
| Line | line | Simple line chart connecting close prices |
| Area | area | Line chart with filled area below |
| Hollow Candles | hollow | Hollow candlesticks - filled when close < open, hollow when close > open |
| Heikin-Ashi | heikin-ashi | Modified candlesticks using averaged values to filter noise |
| High-Low | high-low | Simple bars showing only high and low prices |
| Volume Candles | volume-candles | Candlesticks with width proportional to volume |
| Renko | renko | Price movement bricks that filter out minor price movements |
Usage
// Set default chart type on initialization
const chart = new FCSAPIChart({
    container: document.getElementById('fcs_chart'),
    parentid: 'fcs_chartparent',
    accessKey: 'YOUR_KEY',
    defaultChartType: 'candlestick'  // Set default type
});

// Change chart type at runtime
chart.setChartType('heikin-ashi');
chart.setChartType('line');
chart.setChartType('area');Candlestick: Best for detailed price action analysis
Heikin-Ashi: Smooths out noise, good for trend identification
Line/Area: Clean view for long-term trend analysis
Volume Candles: See volume and price together
Available Timeframes
FCS Chart supports multiple timeframes from 1 minute to 1 month, plus custom timeframes. Choose the appropriate timeframe for your analysis needs.
Supported Timeframes
| Category | Values | Description |
|---|---|---|
| Minutes | 1m, 2m, 3m, 5m, 10m, 15m, 30m | Short-term intraday trading and scalping |
| Hours | 1H, 2H, 4H, 6H, 8H, 12H | Day trading and swing trading |
| Days | 1D | Position trading and long-term analysis |
| Weeks | 1W | Long-term trend analysis |
| Months | 1M | Very long-term investment analysis |
Usage
// Set default timeframe on initialization
const chart = new FCSAPIChart({
    container: document.getElementById('fcs_chart'),
    parentid: 'fcs_chartparent',
    accessKey: 'YOUR_KEY',
    period: '1H'  // Default to 1 hour
});

// Change timeframe at runtime
chart.setPeriod('1D');  // Switch to daily
chart.setPeriod('15m'); // Switch to 15 minutes
chart.setPeriod('4H'); // Switch to 4 hoursYou can use the CUSTOM option in the UI to create custom timeframes like 7m, 25m, 3H, etc. This allows flexibility for specific trading strategies.
Scalping: Use 1m, 2m, 5m for quick trades
Day Trading: Use 15m, 30m, 1H for intraday moves
Swing Trading: Use 4H, 1D for multi-day positions
Investing: Use 1D, 1W, 1M for long-term trends
Full Working Example
A complete, production-ready example showing all features: configuration, theme switching, symbol search, and responsive layout.
Try Live Demo:
• Full Featured Example - Complete implementation with all options
GitHub CDN:
• https://cdn.jsdelivr.net/gh/fcsapi/chart-js/src/fcsapi-chart.js
• https://cdn.jsdelivr.net/gh/fcsapi/chart-js/src/fcsapi-chart.css
Source Code:
• GitHub Repository
- Container Height: Always set a fixed height on the parent container
- Mobile Support: Use the mobile height fix for full-screen charts
- API Keys: Never expose production API keys in client-side code
- Cleanup: Call chart.destroy() when removing chart from page
- Performance: Use displayMode: "chartonly" for embedded widgets
- Caching: Enable enableCache for better user experience
Common Issues & Solutions
Quick solutions to common chart setup and usage issues.
Common Issues
| Issue | Cause | Solution |
|---|---|---|
| Chart not visible | Container has no height | Set explicit height on parent container (e.g., height: 600px or 100vh) |
| No data loading | Invalid API key | Check your API key is valid and has chart access enabled |
| No live updates | Socket not connected | Provide valid socketApiKey and ensure enableSocket: true |
| Symbol not found | Wrong symbol format | Use EXCHANGE:SYMBOL format (e.g., BINANCE:BTCUSDT not just BTCUSDT) |
| UI not showing | displayMode is chartonly | Set displayMode: "normal" or remove the option |
| Chart cut off on mobile | Viewport height issue | Use the mobile height fix (see Installation section) |
Contact support at support@fcsapi.com with your API key, browser console errors, and code samples for faster resolution.
- Check browser console (F12) for error messages
- Verify API key in dashboard is active
- Ensure chart container has defined dimensions
- Test with the live demo first to verify API key works
- Check network tab for failed API requests
- Use console.log(chart.engine) to inspect chart state
Terms & Disclaimer
Important legal information about chart data usage, accuracy, and limitations.
Data Accuracy
Chart data is sourced from multiple exchanges and liquidity providers. While we strive for accuracy, data may not be 100% accurate or suitable for high-frequency trading decisions.
Trading Disclaimer
Charts, indicators, and signals displayed are for informational and educational purposes only. They are NOT intended as trading advice. We bear NO responsibility for any trading losses incurred from using this chart library.
Technical Indicators
All technical indicators are mathematical calculations based on historical price data. Past performance does not guarantee future results. Always use multiple sources of analysis.
Always consult licensed financial advisors before making investment decisions. This chart library is a tool for visualization, not a substitute for professional financial advice.
- Chart data is for informational purposes only
- Not suitable as sole basis for trading decisions
- Prices may differ from actual market prices
- No liability for trading losses or missed opportunities
- Technical indicators are tools, not guarantees
- Always verify data with official exchange sources