
The Ultimate Oscillator sits dead neutral at 49.19. Not oversold, not overbought — just stuck. That's the detail most traders skip right past while they're staring at the big red "Strong Sell" label. But when momentum indicators freeze in the middle range while price action shows bullish movement and the overall signal screams sell, something's disconnected. Ethereum closed at $2050.26 today, down 0.13% from an open of $2052.93. The perpetual contract isn't crashing, but it's not inspiring confidence either.
I've watched ETH bounce around this $2000-$2100 zone for weeks now. Every time it tries to push higher, something drags it back down. The real-time crypto price API data I track shows the pattern clear as day — lower highs since we peaked way back at the all-time high of $4957.67. We're sitting 58% below that number. The all-time low of $84.23 feels like ancient history, but the gap between here and the 200-day simple moving average at $3004.62 is what actually matters right now.
Ethereum / TetherUS PERPETUAL CONTRACT Price Today: The Moving Averages Tell One Story
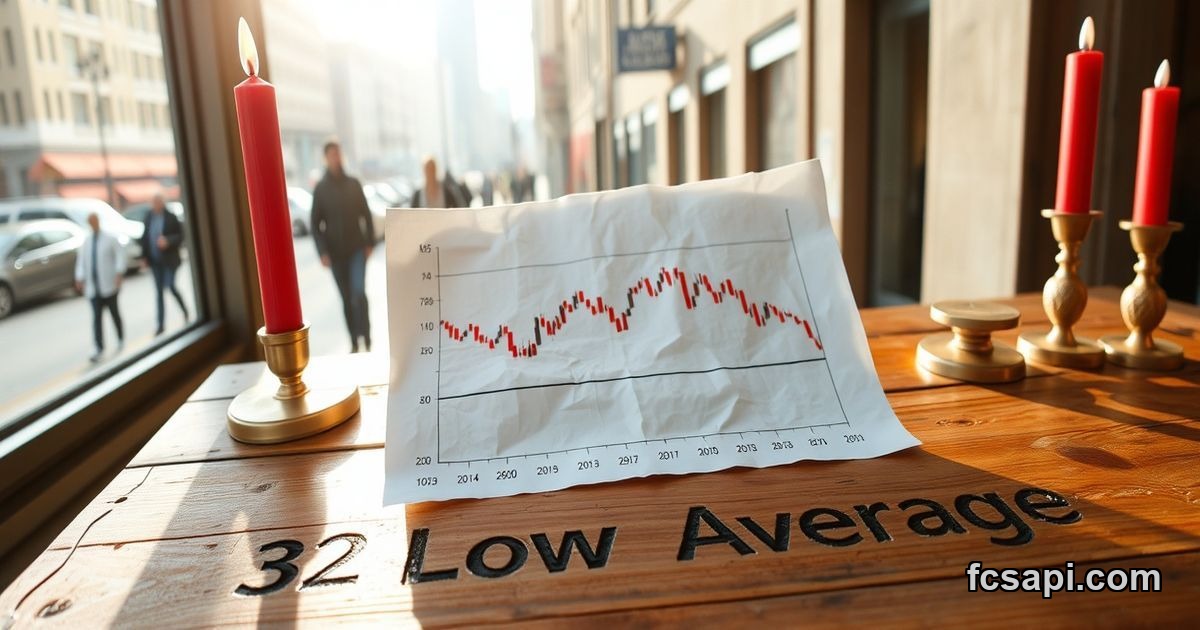
The 10-period exponential moving average sits at $2067.17. Price is below it. That's a Sell signal on its own, but the real damage shows up in the SMA 200. We're talking about a 32% gap between current price and that 200-day line at $3004.62. That's not a little dip you can ignore. That's a Strong Sell screaming at you from the chart.
When the EMA 10 and SMA 200 both point down and you're trading this far below long-term support, rallies don't last. I've been burned before chasing short-term bullish price action when the bigger picture looks like this. You catch a bounce, feel smart for a day, then it rolls over again and you're holding the bag.
Oscillators Send Mixed Messages
The Stochastic K% reading of 44.22 flashes Sell. Not extreme, but leaning bearish. Then you look at the Ultimate Oscillator at 49.19 and it's neutral — right in the middle of the range, showing no directional conviction. That's the problem. When oscillators can't agree and momentum sits flat while moving averages are deep red, there's no edge in jumping in long here.

Bullish price action doesn't mean much if you're fighting against both short-term and long-term trend resistance. I learned that the hard way back in 2022.
Ethereum / TetherUS PERPETUAL CONTRACT Buy or Sell: Pivot Points Map the Battlefield
Fibonacci pivot analysis puts resistance 1 at $2075.88, support 1 at $2040.99, with the pivot point at $2058.43. Current price of $2050.26 is below the pivot and barely holding above S1. The Demark pivots show similar levels — R1 at $2068.48, S1 at $2022.80, pivot at $2053.41. We're sandwiched between support and the pivot, which means we're in no-man's-land.
Breaking below $2040.99 opens the door to that Demark S1 at $2022.80. That's another 1.3% drop from here. Not massive, but enough to hurt if you're long. On the flip side, getting above $2058.43 would flip sentiment, but you'd still have to deal with EMA 10 resistance at $2067.17 right after that. Then Fibonacci R1 at $2075.88. It's resistance stacked on resistance.
Ethereum / TetherUS PERPETUAL CONTRACT Forecast 2026: The Gap That Won't Close
The 200-day moving average problem isn't going away fast. To get back to $3004.62, ETH would need to rally 46% from current levels. That's not impossible — crypto does insane things — but the path from here to there goes through a lot of resistance zones first. You'd have to clear $2100, then $2200, then deal with whatever sellers are waiting at round numbers all the way up.
I don't short crypto because the risk/reward is backwards when volatility spikes. But I'm not buying here either. The real-time crypto price API data doesn't show any fundamental change in momentum structure. The Strong Sell signal exists for a reason — price is trading below key moving averages and oscillators aren't giving bullish confirmation. When Stochastic K% says Sell and Ultimate Oscillator sits neutral, that's not a "buy the dip" setup. That's a "wait for confirmation" setup.
Ethereum / TetherUS PERPETUAL CONTRACT Support Resistance Levels That Matter
Support levels to watch:
- $2040.99 — Fibonacci S1, current floor
- $2022.80 — Demark S1, next level down
- $2000 — psychological round number
Resistance levels blocking upside:
- $2058.43 — Fibonacci pivot point
- $2067.17 — EMA 10
- $2075.88 — Fibonacci R1
If you're trading this, those are your lines. Break below $2040 and you're probably testing $2022. Break above $2067 and maybe, maybe you've got a shot at $2075. But right now we're stuck in the middle with a Strong Sell signal hanging over the whole thing.
Ethereum / TetherUS PERPETUAL CONTRACT Analysis: What the Crypto WebSocket API Shows
Real-time tracking through a crypto WebSocket API makes it obvious when price is just chopping around versus when it's actually trending. ETH is chopping. The 0.13% daily loss is nothing. The bullish price action label is misleading when you zoom out and see where we are relative to the 200-day average. We're not in a bull trend. We're in a bear market bounce that hasn't broken any important resistance yet.
The FCSAPI data I use updates fast enough to catch these pivot point tests in real time. When price approaches $2040.99 or $2058.43, you can see the reaction instantly. So far, sellers show up every time we test the upper range. Buyers step in near the lower support, but they're not strong enough to push through resistance. That's a range, not a reversal.
Ethereum / TetherUS PERPETUAL CONTRACT Target Price: What It Would Take
For ETH to flip bullish, you'd need to see:
- Price close above $2067.17 (EMA 10)
- Stochastic K% flip to Buy territory above 80
- Ultimate Oscillator break above 50 with momentum
- Multiple daily closes above the pivot point
None of that is happening right now. We're below the EMA, oscillators are neutral or bearish, and we can't even hold above the pivot point. Until that changes, the Strong Sell signal is the right call. I hate agreeing with signals that feel obvious, but sometimes the obvious answer is correct.
Ethereum / TetherUS PERPETUAL CONTRACT Outlook: My Honest Take
I'm sitting this one out. The 32% gap to the 200-day moving average bothers me more than the daily price action excites me. Bullish price movement in a Strong Sell environment usually ends badly. You might catch a 5% bounce to $2150 if we break resistance, but you're risking a drop back to $2000 or lower if support fails. That's not a trade I want.
If you're already long from lower levels, the recent analysis would suggest tightening stops below $2040. If you're thinking about entering now, wait for price to reclaim the EMA 10 and pivot point before committing. The crypto WebSocket API data will tell you immediately when that shift happens — until then, this is a wait-and-see situation. Strong Sell signals don't always play out fast, but they usually play out eventually.
