Today, March 13, 2026, the Hong Kong 33 sits at 25679.4. That’s up a respectable 0.578% for the day, which usually gets people feeling good. But don't let that green number fool you. The core signals tell a completely different story.
I've seen these kinds of days before – a slight positive bump inside what looks to be a much larger trend reversal. It tricks you into thinking the storm has passed. Spoiler: it probably hasn't.
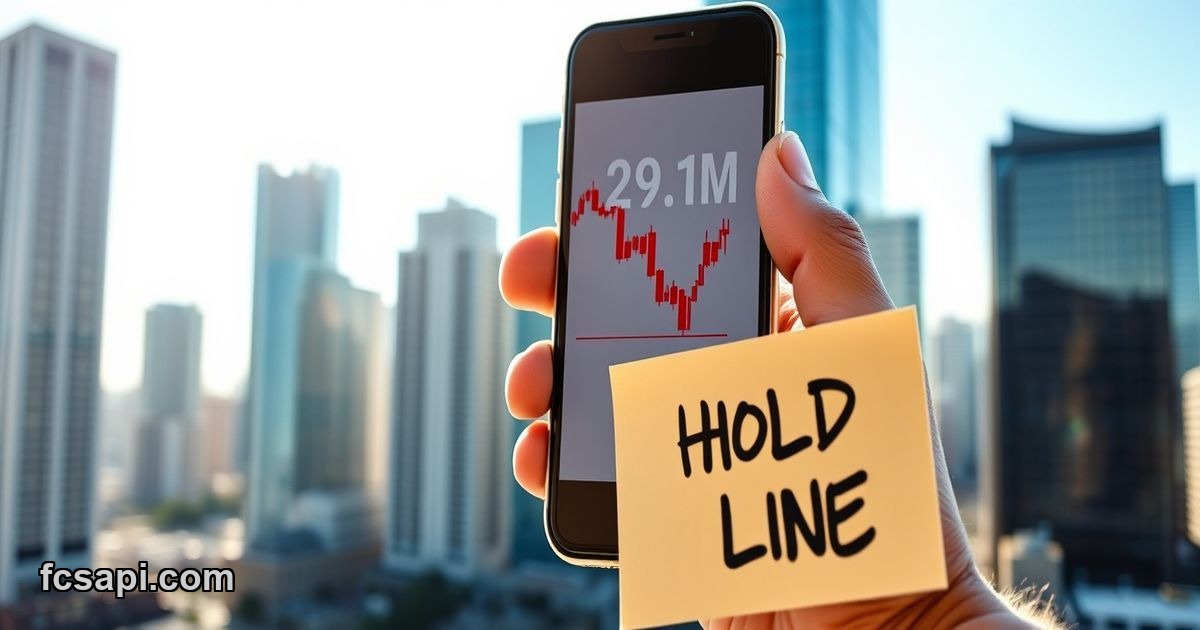
The Bull Trap Unfurling on Hong Kong 33
You’ve got to scratch your head looking at some of these numbers. The "Price Action" shows bullish, yet the overarching "Signal" is a clear Sell. How does that make sense? It means the short-term bounces are just that: short-term bounces.
The market's "Confidence" in this move? Only Medium. The "Trend" is "Moderate". Neither screams conviction. When the market can't even commit to its own direction, that's a red flag for volatility, which we certainly have a lot of right now.
Take a look at the oscillators. The Ultimate Oscillator is just hanging out at 48.4243, firmly neutral. It’s not giving a directional push either way, which leaves us with the other, more decisive indicators. And those aren't pretty if you're holding long.
Moving Averages Scream "Strong Sell"
This is where things get really clear, really fast. The SMA 25 is way up at 26322.12. Our current Hong Kong 33 price today of 25679.4 is sitting well below that critical level. The system slaps a "Strong Sell" on that one for a reason.
Falling significantly below a key moving average like the 25-period SMA usually means momentum has shifted hard. It's a big hurdle for bulls to overcome, and right now, they're not even close. Every rally needs to reclaim that level to even start talking about a bullish reversal.
Then you've got the EMA 10 at 25763.14. The price is currently beneath it. It's only a neutral signal, sure, but it reinforces the fact that even the short-term average is acting as resistance. Bulls need to close above this line, consistently, to show any real strength.
Pressure from Pivots and Bands
Let's talk about the Classic Pivot Points. The daily pivot is at 25582.27, and yes, we're currently above it. That's a good sign for today’s session. But look at R1: 25781.03. We're just shy of that, struggling to break through.
This is classic market behavior: hit resistance, fail, and then often retreat back to the pivot, or worse, below S1. The Stochastic K% is also flashing "Sell" at 35.4093, confirming that momentum is waning, making any break of R1 a tough climb. The signals are pretty aligned here, which is usually when you start paying close attention.
The Bollinger Bands also paint a worrying picture. The middle band is the same as the SMA 25, 26322.12. The price is significantly below it, further cementing the bearish trend. More critically, the price's "Position" in the bands is at a low 21.42%. This means we’re near the bottom band.
Usually, a position near the lower band can hint at oversold conditions, but it also screams persistent selling pressure when combined with a Strong Sell from MAs. The "Squeeze" is "Normal," so no big, explosive moves from a tightened range are on the immediate horizon from that indicator. However, with "Volatility" marked "High" (ATR% at 2.2626), we’re still looking at some choppy, unpredictable trading days ahead.
Don't Fall for the 1W Performance Trick
Yes, the Hong Kong 33 is up 1.58777% over the last week. And it’s up today. Great. Everyone loves seeing those numbers. But in the context of everything else, this smells like a bull trap. A last gasp. It's not uncommon to see a short-term rally within a broader downtrend.
I’ve made the mistake of chasing these rallies before, only to get burned when the heavier, long-term trends reasserted themselves. The stronger indicators are not confirming this minor upside. This is where an FCS API often saves me from myself, presenting the data raw, without the emotional pull.
Our overall "Signal" is Sell. The key moving averages are "Strong Sell" or leaning bearish. The Bollinger Bands show price in the lower quantile. These are powerful counter-arguments to a simple "it went up this week, let's buy." Sometimes the market just needs to breathe out before it continues its descent.
For more deep dives into market trends and to see what other analysts are saying, you can check out the FCS API blog. It’s important to get as many perspectives as you can, especially when signals are conflicting this much.
So, Is Hong Kong 33 a Buy or Sell?
Based on today’s data for Hong Kong 33 price today, the answer leans heavily towards Sell. The short-term gains and bullish price action are enticing, but they are overshadowed by stronger, more consistent bearish signals across multiple technical indicators. This could easily be a temporary bounce that will face significant resistance.
The market seems to be telling us that the 26322.12 level (SMA 25 and Bollinger Middle) is a formidable barrier. Until the Hong Kong 33 can convincingly reclaim that, and turn the longer-term moving averages upwards, any Hong Kong 33 forecast 2026 for a sustained rally feels premature.
A sensible Hong Kong 33 prediction would suggest we’re more likely to test lower support levels first, potentially pushing towards the S1 pivot at 25263.23 or even lower, especially with the high volatility. Ignoring these strong sell indicators and chasing a fractional daily gain would be a risky play in my book.
For those looking to integrate such detailed data into their own trading strategies, exploring different FCS API pricing plans can provide access to these critical real-time signals, helping you make more informed decisions rather than guessing based on surface-level changes.