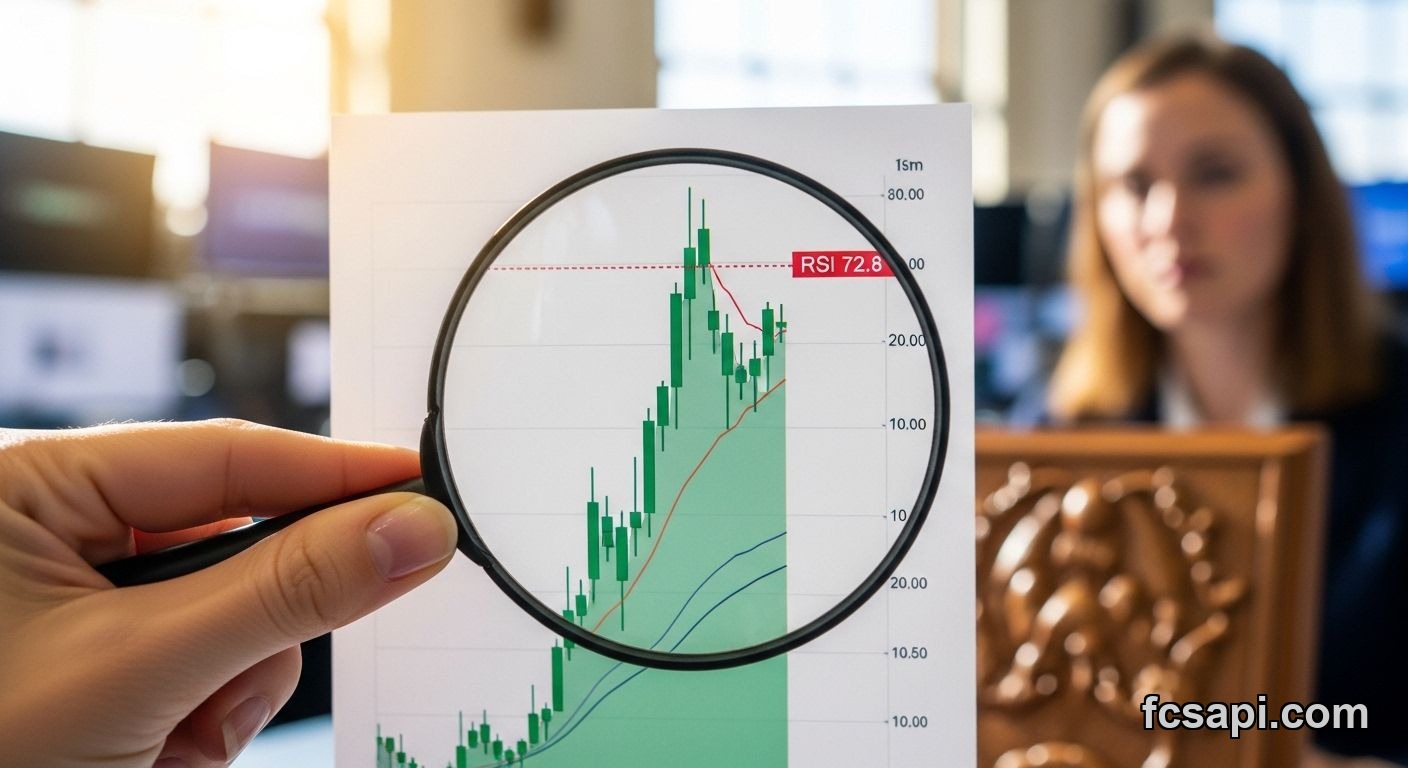
RSI sits at 72.8 — textbook overbought territory — while MACD Level flashes 678 million in the green. Market Cap HYPEH, $ closed today at $10,959,246,018, up from an open of $10,579,905,295. That's a 3.58% single-day climb. The signal says Buy with a score of 59.2, but one oscillator is throwing a tantrum.
Market Cap HYPEH, $ Price Today: The Overbought Problem
Price hit $10.9 billion. RSI hit 72.8. Anything above 70 is considered overbought — too many buyers, not enough sellers, usually means a pullback is brewing. But MACD Level disagrees. Hard. At 678,414,144.79, it's screaming Strong Buy. So which one do you trust?
I've seen both fail. RSI can stay overbought for weeks in a real rally. MACD can flip negative overnight if momentum dies. But here's what I know: when RSI crosses 70 and price keeps climbing, it's either the start of a parabolic run or the final push before a dump. No middle ground.
Market Cap HYPEH, $ Buy or Sell: What the Moving Averages Say
All three moving averages line up bullish. SMA 100 at $8.4 billion — price is 30% above that. EMA 25 at $8.9 billion — price is 22% above that. SMA 25 at $8.5 billion — price is 28% above that. Every single one says Strong Buy.
When short-term and long-term averages both point up, that's confirmation. Price isn't just spiking on a fluke — it's been trending higher for weeks. The 25-day averages show recent strength. The 100-day average proves this isn't a one-week pump.
But. Price is stretched way above those averages. The gap between current price and EMA 25 is $2 billion. That's not sustainable forever. Either the averages catch up fast, or price comes back down to meet them.
Market Cap HYPEH, $ Support and Resistance Levels
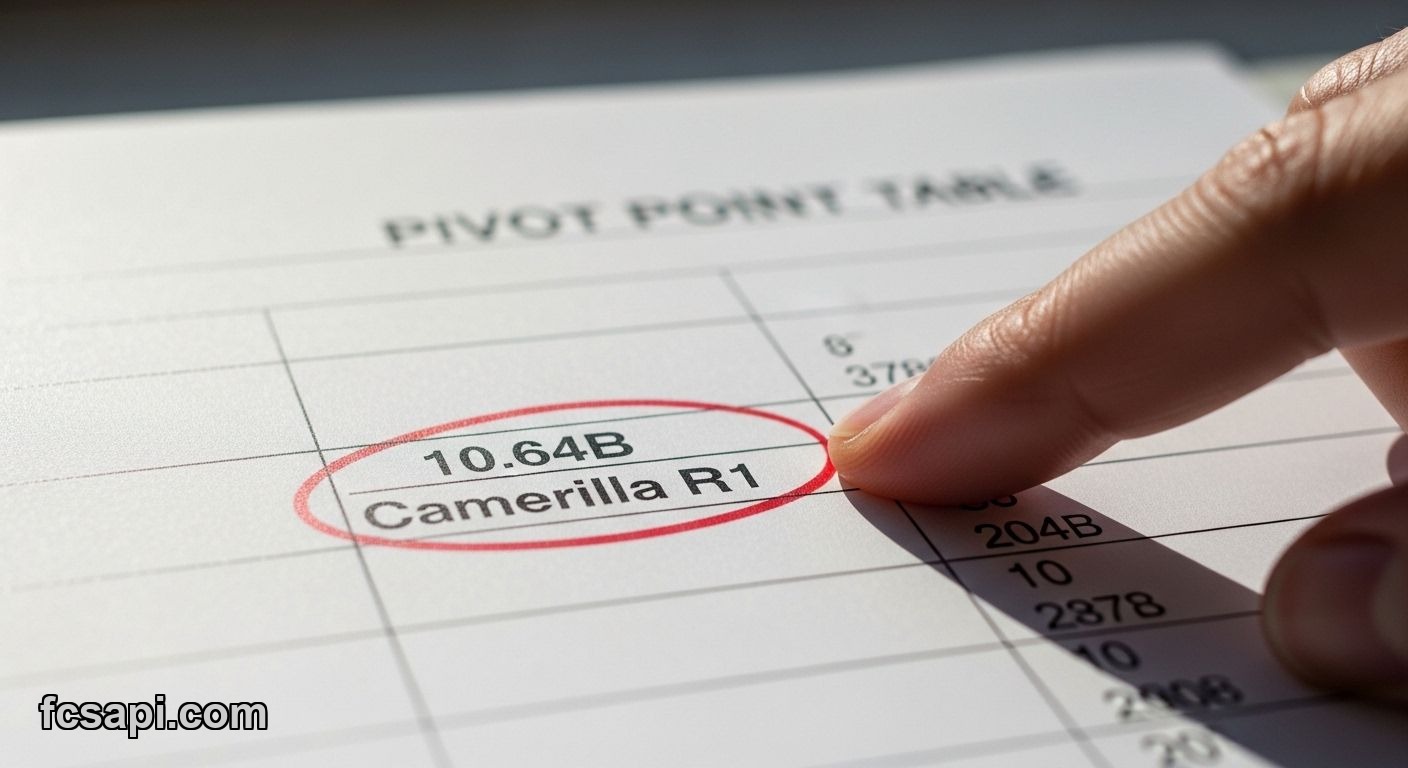
Camarilla pivot points give us the short-term map. R1 resistance at $10.64 billion — already broken. S1 support at $10.52 billion. Pivot at $10.58 billion. Price is trading above all three right now.
That's bullish in the moment, but here's the risk: if price loses $10.64 billion support (which used to be resistance), it'll probably fall back to the pivot at $10.58 billion. Lose that, and $10.52 billion is next. Below $10.5 billion, things get ugly fast.
One-month range tells the bigger story. Low at $6.6 billion. High at $11.2 billion. Price is sitting 97% of the way toward that high. Not much room left before you hit the ceiling. All-time high was $19.8 billion — still 81% away — but that feels like ancient history right now.
Market Cap HYPEH, $ Forecast 2026: Momentum vs Exhaustion
Signal score of 59.2 is weak for a Buy. That's barely past neutral. A strong Buy would be 70+. This is more like "leaning bullish, but don't get cocky." The Hammer candle pattern supports that — it's a reversal signal after a dip, suggesting buyers stepped in at lower prices today.
MACD Level at 678 million is the strongest indicator here. That's pure momentum. When MACD is positive and climbing, price usually follows. Problem is RSI at 72.8. Those two indicators are fighting each other. MACD says keep going. RSI says slow down.
I've traded through this setup before. Half the time, RSI wins and you get a 5-10% correction. The other half, MACD wins and RSI just stays high while price rips another 20%. You don't know which until it happens.
Market Cap HYPEH, $ Analysis: The Smart Play Right Now
If you're already holding, don't sell just because RSI is high. The trend is clearly up — all moving averages confirm that. But don't add more at $10.9 billion either. You're buying near the top of the one-month range. Wait for a pullback to $10.5 billion or lower. That's where support sits.
If you're not in, wait. Price needs to prove it can hold above $10.6 billion for more than a day. A close below that level tomorrow would flip the short-term picture bearish. A close above $11 billion would break the one-month high and probably trigger another leg up.
Check the currency converter if you're tracking this in different denominations — sometimes psychological levels hit differently depending on your base currency. And if you're pulling data yourself, the API pricing plans on FCSAPI cover real-time feeds for assets like this.
Market Cap HYPEH, $ Prediction: What Happens Next
Bullish price action plus a Hammer candle usually means buyers are in control. But overbought RSI means they might be running out of steam. The one-month high at $11.2 billion is the next test. Break that, and $12 billion is possible. Fail at $11 billion, and we're probably heading back to $10.5 billion or lower.
MACD and moving averages say the trend is your friend. RSI says the friend is getting tired. I'd watch the next 48 hours closely. If price consolidates here without dropping below $10.6 billion, that's a sign of strength. If it gaps down tomorrow, that's RSI proving it was right all along.
For more takes on market setups like this, check out the blog — I break down data like this every week.
Market Cap HYPEH, $ will either punch through $11.2 billion in the next few days or pull back to $10.5 billion — the current setup won't hold forever.