
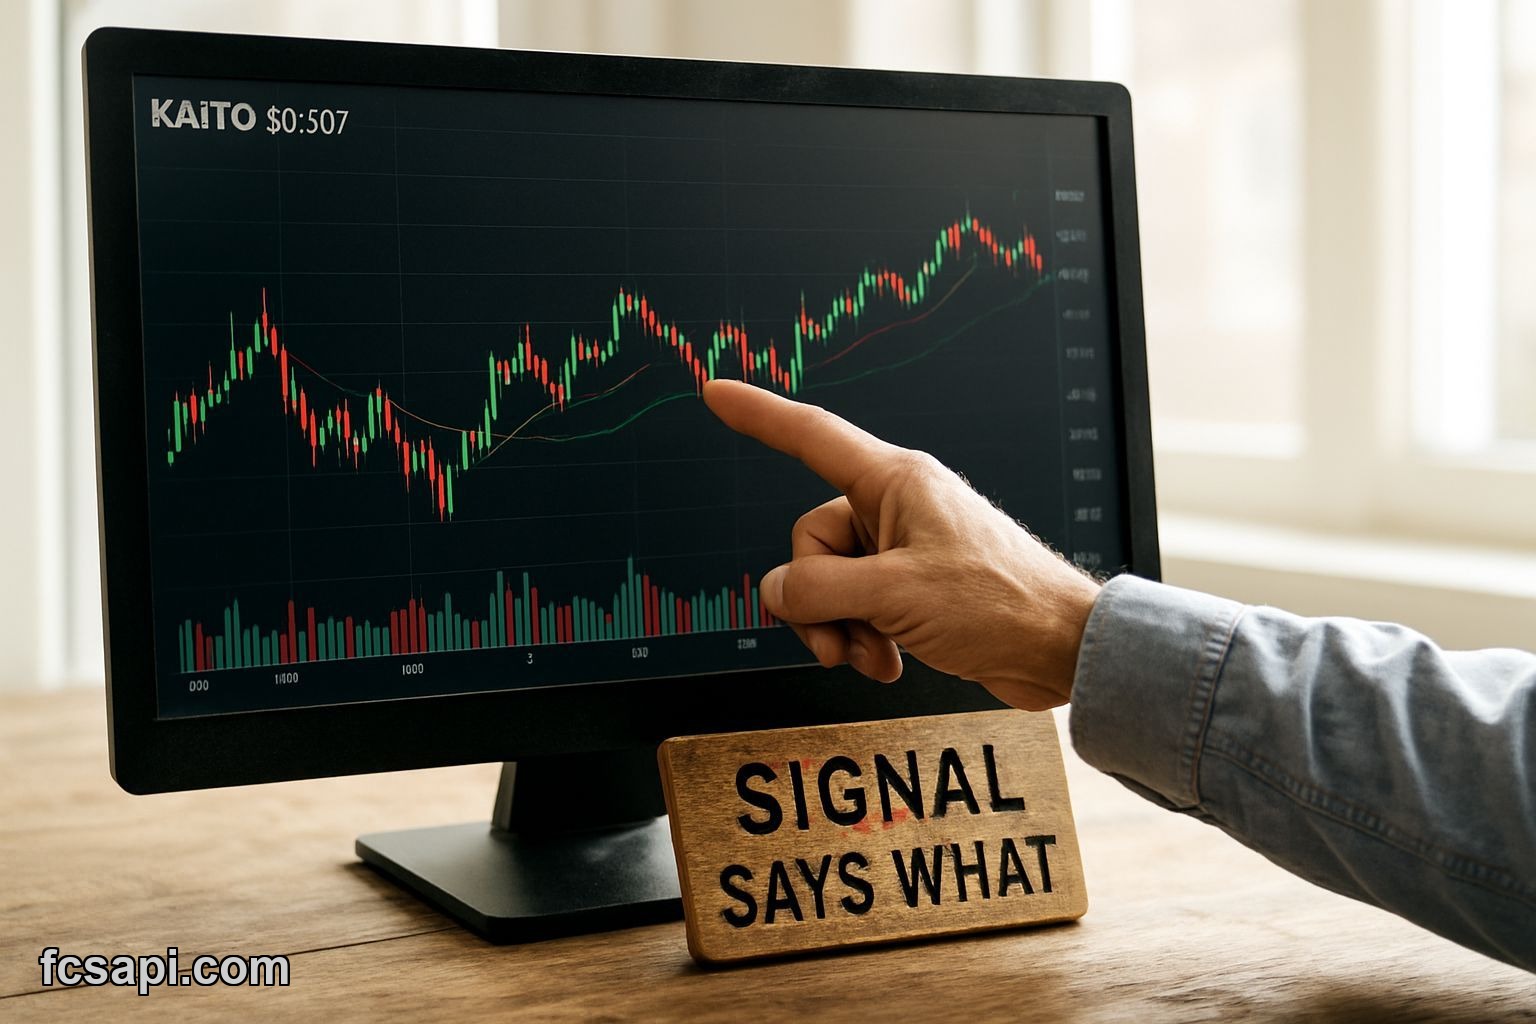
The price climbed 4.4% today. The signal says Weak Sell. Already we've got a problem.
Market Cap KAITO sits at $82 million right now, up from a $78.5M open. That's movement. But zoom out six months and you're staring at a -69% hole. One week? Up 13.7%. The whiplash is real.
The Signal Contradiction Nobody's Explaining
Here's what I'm looking at. Price action is bullish. The signal is Weak Sell. Confidence is Low. This isn't a minor disagreement between indicators—it's the market telling you it doesn't know what it wants yet.
ADX sits at 28.37, marked as Strong Buy. That measures trend strength, and anything above 25 means the trend has legs. Problem is, which trend? The Stochastic K is at 82.8, firmly in overbought territory but still flagged as a buy. Ultimate Oscillator at 59.4 just shrugs—neutral.
I've seen this setup before. When oscillators split like this, one of two things happens: either the price breaks hard in one direction within a week, or it chops sideways and bleeds out your patience. Based on the 8.37% ATR volatility reading, I'm betting on the first option.
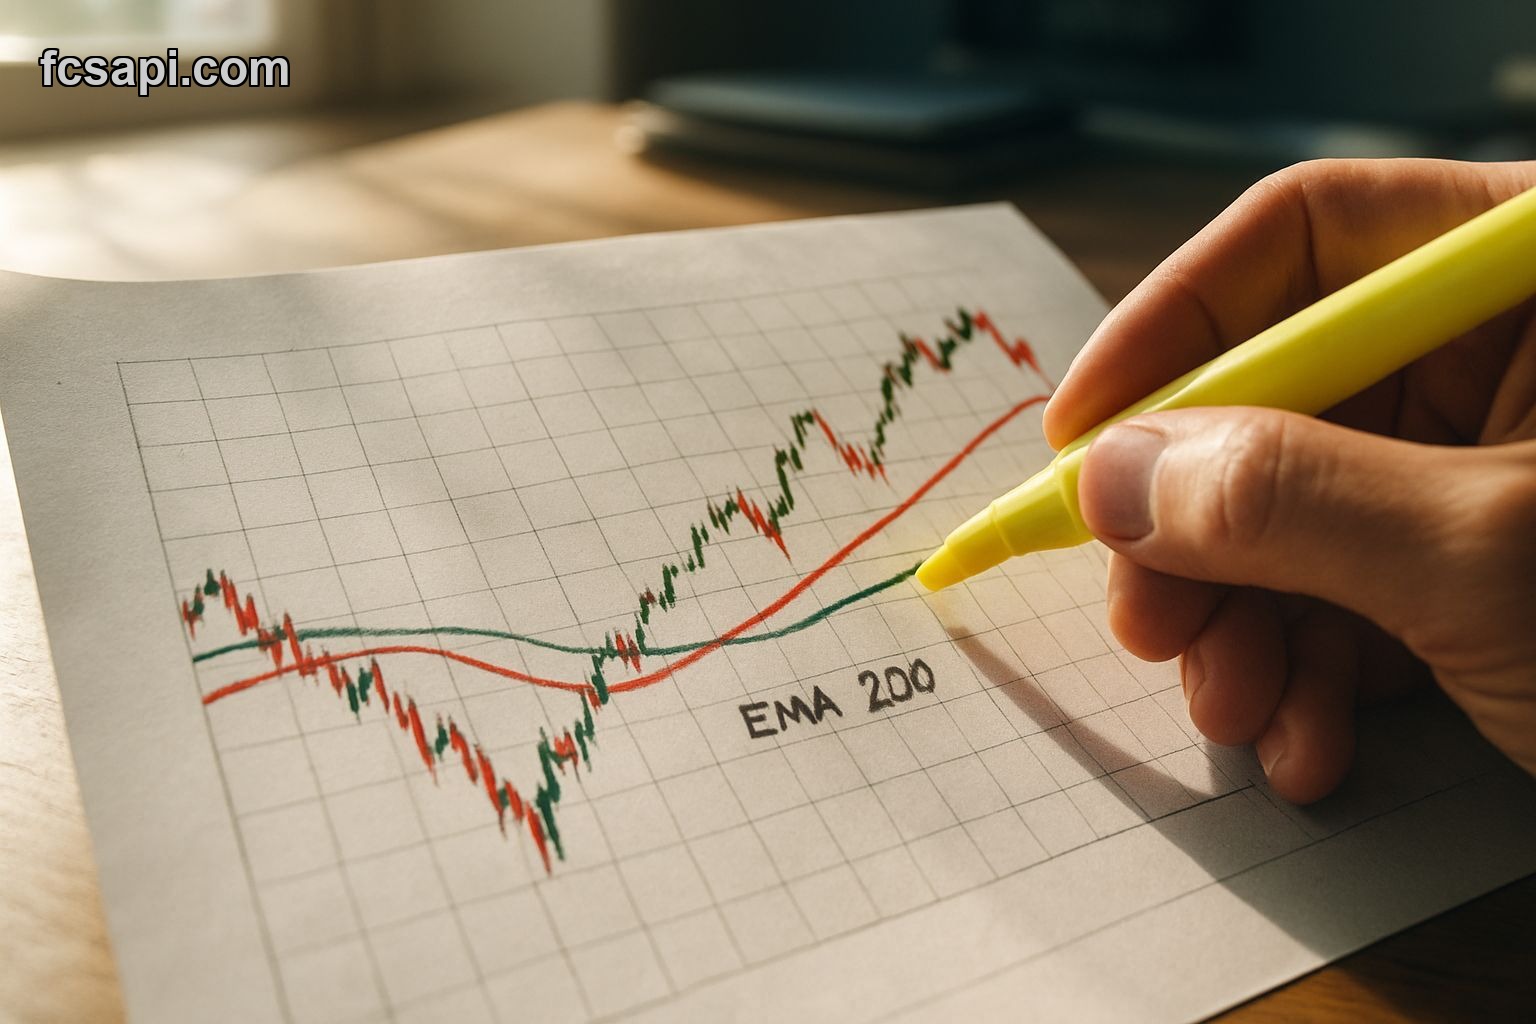
Moving Averages Are Screaming Different Stories
The short-term EMAs are all green lights. EMA 10 at $76.7M? Strong Buy. EMA 25 at $80.7M? Strong Buy. Price is above both, which normally I'd take as confirmation to hold or add.
Then you hit the EMA 200 at $178.2M. Strong Sell. The price is sitting at less than half that level. This is the long-term anchor dragging everything down. Six months ago, this thing was over $250M based on the drawdown math. Now it's scraping $82M.
What does that mean practically? If you're swing trading, the short EMAs say ride it. If you're trying to figure out whether this is a bottom or a bounce in a bigger slide, the 200-day is telling you we're still in structural decline. I'm not saying ignore the short-term buy signals—I'm saying don't confuse a relief rally with a reversal.
Bollinger Bands and That 73% Number
The Bollinger middle band is at $76.8M. Price is currently at 73.03% of the band width. That's not a squeeze—it's just positioning. But it's close enough to the upper band that another push could hit resistance fast.
| Metric | Value |
|---|---|
| Current Price | $82.06M |
| Bollinger Middle | $76.87M |
| Band Position | 73.03% |
| ATR Volatility | 8.37% |
High volatility, upper band proximity, mixed signals. This is not a setup I'd size heavily into. Maybe you nibble here if you think the one-week momentum continues, but I wouldn't bet the farm on it holding above $80M for long.
Pivot Points Say What Exactly
Fibonacci pivot resistance 1 is at $80.93M. We're already above it. Support 1 is way down at $76.5M, and the pivot point itself is $78.7M. Classic pivots give R1 at $81.5M—basically where we are now—and S1 at $75.7M.
So the price is testing resistance as we speak. If it fails here, the next stop is a 7% drop back to support. If it breaks through, there's not much overhead until you start comparing it to where this thing was trading a month ago. The one-month high was $104.3M. That's 27% above current levels. Good luck.
What I'm Actually Doing With This
I'm not holding KAITO long-term. The six-month performance killed any illusion of a sustained uptrend. But the one-week bounce and the short-term EMAs lining up? That's a trade, not an investment.
If I were in right now, I'd have a stop below $76M—just under that Fibonacci support and the Bollinger middle. Target? Maybe $85M, maybe $88M. Nowhere near the monthly high because I don't believe that's happening without a major catalyst. The crypto API documentation I pull this data from updates live, and I check it twice a day when I'm in something this choppy.
The Weak Sell signal with Low confidence isn't something to ignore. It's not screaming "get out now," but it's also not giving you permission to relax. Confidence matters. Low confidence means the model itself isn't sure, which usually means the market structure is messy.
The Six Month Hole Is the Real Story
Down 69% in six months. Up 4.4% today. See the problem? You can win five trades in a row and still be underwater if the big move was down. That's KAITO in a sentence.
People get excited about 13% weekly gains and forget they're still holding a bag that's worth a third of what it was half a year ago. I'm not saying it can't recover—stranger things have happened—but the burden of proof is on the bulls here, not the bears.
The data from FCS API doesn't editorialize. It just shows you where things are. Right now, where things are is "bouncing inside a larger downtrend with mixed signals and a Weak Sell tag." If that sounds like a clear trade to you, you're braver than me.
My Take
I'd trade this, not hold it. The setup is too contradictory for conviction. You've got bullish price action, overbought oscillators, strong short-term EMAs, and a Weak Sell signal with low confidence. That's not a signal—it's a coin flip with extra steps.
If you want to track the Market Cap KAITO price today or run your own analysis, the API pricing plans are worth checking if you're serious about this stuff. I pull data multiple times a day when I'm trading anything with 8%+ ATR volatility.
I'm not calling a top or a bottom here. I'm calling it what it is: a bounce that might continue or might fail, inside a six-month downtrend that hasn't been invalidated yet. Trade it if you want. Just know what you're getting into.

