
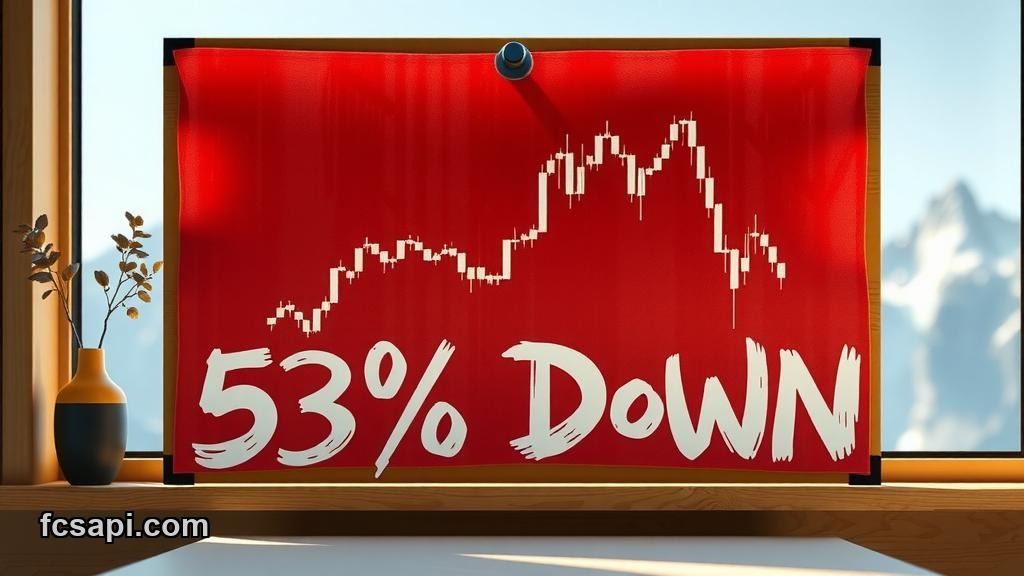
OKB's market cap sits at $1.97 billion today. That's down from a $2 billion open, and more importantly, it's nowhere near where it was six months ago — the asset is off 53% in that span.
I've watched plenty of altcoins bleed out over half their value in a bear cycle. What bothers me here isn't the percentage drop itself. It's the pattern underneath.
The Gap Between Price and Moving Averages
The 200-day simple moving average sits at $2.72 billion. That's a 38% premium to current levels. The 100-day exponential moving average is at $2.08 billion — still above where we're trading now.
When you're trading below both your short-term and long-term moving averages by this much, you're not in a dip. You're in a downtrend. The signal flashing "weak sell" makes sense when you line up the context.
The 10-day SMA is at $1.98 billion, right where we opened. We couldn't hold above that level today.
What The Oscillators Say
Stochastic K% is at 43.9, which technically registers as a sell signal. Not oversold territory — that comes below 20 — but clearly not bullish momentum either. We're in that middle zone where things can break either way, and right now the moving averages suggest down.
ATR is elevated at 135.7 million, registering as a buy signal in the data. That's volatility, not direction. High ATR means the market cap is swinging hard. Could be opportunity if you know what you're doing. Could be a way to lose money faster if you don't.
I don't trade volatility signals in isolation. ATR tells you how much things are moving, not where they're going.
Pivot Points and Recent Range
Woodie pivot resistance sits at $2.01 billion with support at $1.98 billion. We're right in that pocket. The Fibonacci pivot has resistance at $2.01 billion and support at $1.98 billion too — same story, different calculation method.
Over the past month, OKB's market cap hit a high of $2.6 billion and a low of $1.51 billion. That's a billion-dollar range. We're closer to the low than the high right now, which matches the weak sell signal.
| Timeframe | Performance |
|---|---|
| 6 Month | -53.28% |
| 1 Month High | $2.60B |
| 1 Month Low | $1.51B |
That six-month number is brutal. You don't bounce back from a 53% haircut overnight, especially when every major moving average is above you.
The Hammer Pattern Complicates Things
Here's where it gets messy. The candle pattern today registered as a hammer, which is typically a bullish reversal signal. Price action is marked bullish. But the overall signal? Weak sell.
I've been burned before taking hammer candles at face value when the broader trend is clearly down. A single-day pattern doesn't override weeks of moving average crossovers pointing south. The hammer might hold tomorrow. Or it might just be a brief pause before another leg down.
The confidence level on this signal is low, which is the data telling you it's not screaming obvious either way. When I see conflicting signals like this, I sit on my hands. No position is a position.
What I'd Actually Do
I'm not buying here. The moving averages are too far above, the six-month performance is terrible, and "weak sell" with "low confidence" translates to "unclear, probably bad" in my book. If you're already holding OKB, you need to decide if you believe in a turnaround that gets you back above that $2.08 billion 100-day EMA. I don't see the catalyst yet.
If you want to track this kind of market cap data in real-time for your own analysis, FCS API covers crypto assets with the same indicators and signals I'm referencing here. You can pull historical data, compare moving averages, and build your own alerts when assets hit pivot levels. Check the pricing page if you need access beyond free-tier limits.
The hammer pattern today might mark a bottom. Or it might just be a speed bump on the way to testing that $1.51 billion low again. Until OKB's market cap closes above the 10-day SMA and holds it, I'm staying out.

