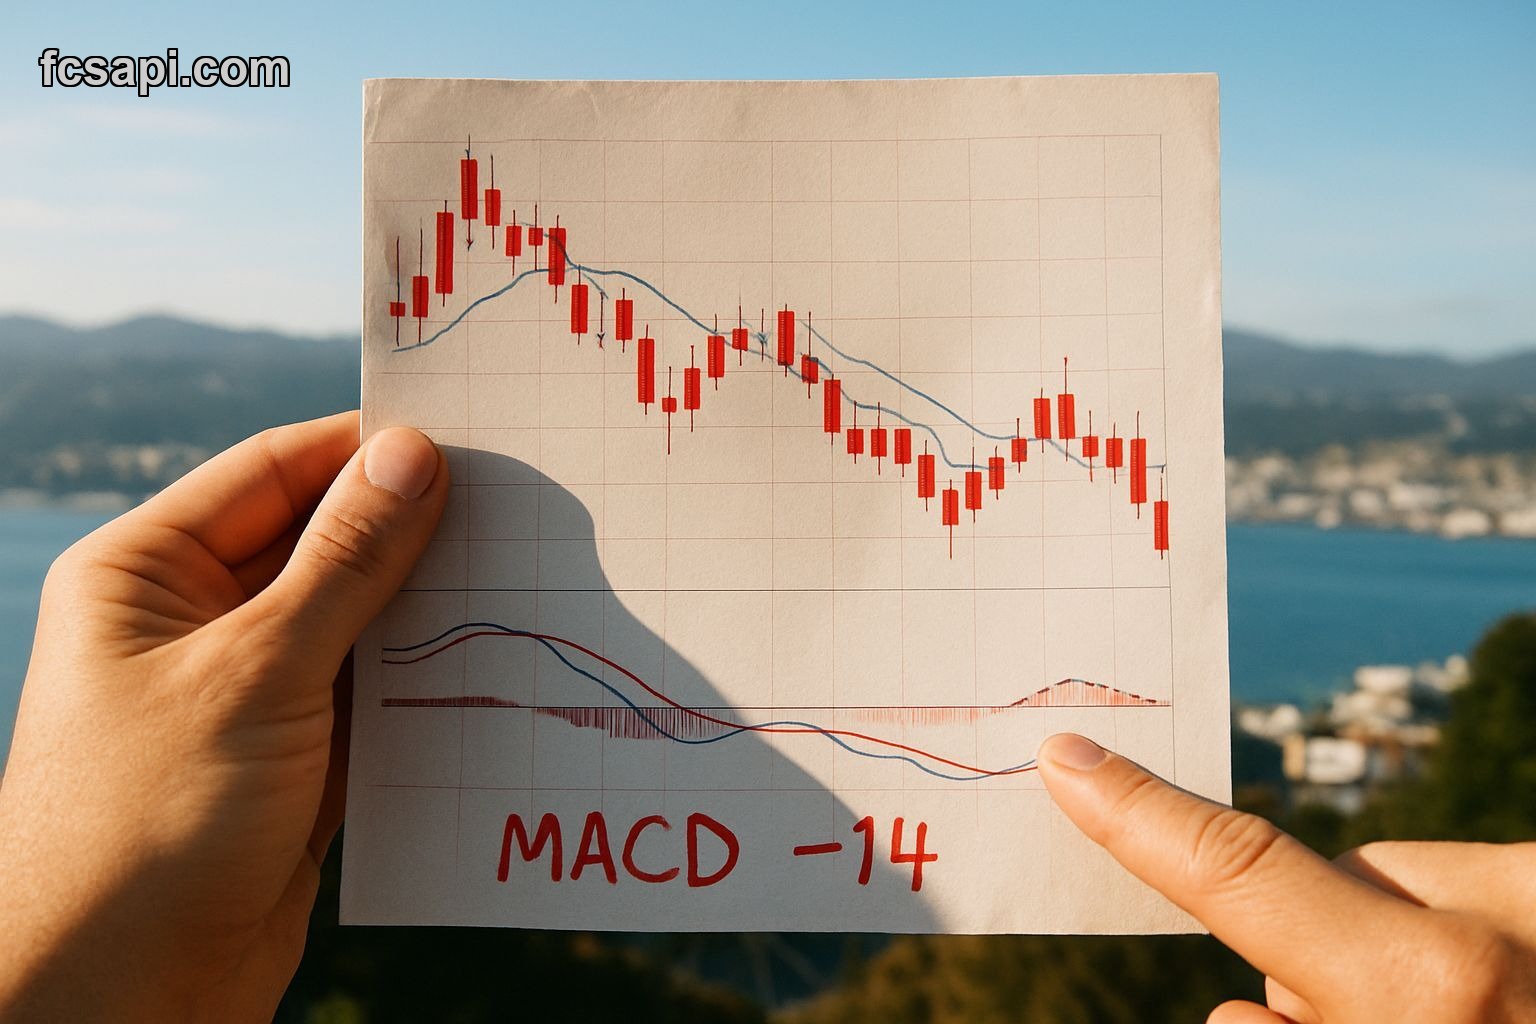
The MACD is sitting at -14.0756 on NZDUZS right now. That's a strong sell signal by any textbook definition. But the price dropped just 0.28% today from open at 7185 to 7165. Not exactly a collapse.
Here's what makes this pair annoying to trade — low confidence rating, neutral overall signal, bullish price action all happening at once. The data's all over the place. Which makes sense when you're looking at an exotic cross nobody talks about outside central Asia trade desks.
The MACD Problem
Strong sell on MACD usually means momentum's shifting down. But look at ADX at 21.20 showing strong buy. ADX measures trend strength, not direction. So we've got trend strength building while momentum indicator says bail.
RSI at 43.62 is neutral. Not oversold, not overbought. Just sitting there doing nothing useful. When your oscillators can't agree, the chart's probably consolidating or setting up for a break.
I've seen this setup before on thin pairs. The MACD dives because volume's light and a few big trades push it around. Doesn't always mean the trend's dead. Sometimes it's just noise from low liquidity.
Support Levels That Actually Matter
Camarilla pivot has S1 at 7236 and R1 at 7240. That's a 4-point range, which is absurdly tight. Current price at 7165 is way below both. So we're trading under support already.
EMA 100 at 7145 is close — just 20 points below where we closed. That's the line. If 7145 holds, we get a bounce. If it breaks, next stop is probably the monthly low nobody wants to calculate because this data doesn't show it.
All-time low for this pair was 316. We're at 7165. So we're nowhere near historical panic levels. One-month high hit 7456, which means we're down about 291 points from recent peak. That's a 3.9% pullback in a month.
Why Volatility Matters More Than You Think
ATR at 0.60% says volatility is low. For an exotic cross, that's weird. Usually these things whip around. Low vol means either nobody's trading it or we're in the calm before something breaks.
When ATR drops on a cross like NZDUZS, I get cautious. It means the spread's probably terrible and you're fighting the market maker more than actual price movement. Check the currency converter before you trade this — the bid-ask on exotics can eat your edge.
EMA 25 at 7229 is a sell signal. We're 64 points below it. That's far enough that any bounce attempt has to clear multiple resistance layers. Not impossible, just annoying to trade.
The Moving Average Mess
Two EMAs, two different stories. The 25-day is bearish, 100-day neutral. Price below the 25, above the 100. Classic squeeze pattern. Either we break down through 7145 or rip back up through 7229.
I don't love trading in the middle of this setup. You're basically gambling on direction with no confirmation. If you're pulling live data from a forex API and backtesting, you'd probably skip this entry entirely and wait for a clean break.
The candle pattern shows normal. No hammers, no engulfing, nothing. Just a boring red day with a small drop. That tells me the market doesn't care yet.
What I'd Do With This Setup
I'm not touching it. Neutral signal, low confidence, conflicting indicators. The only thing clear is the MACD sell, and I don't trust one indicator on a thin pair.
If I had to take a side, I'd lean bearish based on price below EMA 25 and the MACD dive. But I'd wait for a break of 7145 before entering short. That's the EMA 100 support level and the last real defense before things get ugly.
On the flip side, if we get back above 7229, the MACD signal becomes noise and the bullish price action takes over. But we're 64 points away from that. A lot can go wrong in between.
| Indicator | Value | Signal |
|---|---|---|
| MACD | -14.08 | Strong Sell |
| ADX | 21.20 | Strong Buy |
| RSI | 43.63 | Neutral |
| EMA 25 | 7229.58 | Sell |
| EMA 100 | 7145.19 | Neutral |
The Uzbekistani Som Factor
Let's talk about the som for a second. It's not freely convertible. The Uzbek central bank controls the rate. That means NZDUZS is less about New Zealand monetary policy and more about whatever Tashkent decides to do with currency controls.
Exotic crosses with controlled currencies trade differently. You're not just analyzing technicals — you're betting on policy decisions from a government that doesn't publish meeting minutes or inflation targets like the Fed.
This is why confidence is low on the signal. The model can read the chart, but it can't predict a central bank intervention or a sudden devaluation. If you're serious about trading this, you need local news sources, not just FCS API data. Though the API gives you the price action in real time, which is better than nothing.
Volume and Liquidity Reality Check
We don't have volume data here, but I guarantee it's thin. Pip value on NZDUZS is not something your broker advertises. Slippage is real. Stop losses don't always fill where you want.
I traded an exotic som cross once. Made 2% on paper, lost 1.5% to spread and slippage. Never again. If you're backtesting strategies and want to include realistic costs, check the API pricing plans for feeds that include spread data.
The Demark pivots show R1 at 7251 and S1 at 7225. We're below both. That's another bearish tick. Pivot systems work better on liquid pairs, but even here the message is clear — we're trading in the bottom half of the expected range.
March 2026 Context
We're in mid-March. No major NZ economic releases this week that I know of. The Reserve Bank of New Zealand hasn't met recently. So this move is probably som-side driven or just random noise from low participation.
If you're holding NZDUZS for some reason — maybe you're a business hedging Uzbek som exposure — you're probably not thrilled right now. Down 0.28% today, down 3.9% from the month high. Not a disaster, but not great either.
For speculators, this is a pass. Wait for the EMA 100 break or the EMA 25 reclaim. Trading in the middle of conflicting signals on a low-liquidity pair is how you donate money to market makers.