Look, I’ve seen some messed-up charts in my time, but the signals coming off the Crypto Total Market Cap Excluding Top 10, $ (OTHERS) today, February 27, 2026, are genuinely something else. You get paid for clear calls, not for scratching your head, and right now, the market for everything outside the top ten cryptos is a big, confusing mess.
On one hand, the dominant signal is screaming "Strong Sell." It's hard to argue with that kind of conviction. Then you look a little closer, and it's flashing bullish signs right back at you. Talk about whiplash. This isn't just noise; it’s a full-on shouting match between indicators, and traders are stuck in the middle.
The Blatant Red Flag
Let's not sugarcoat it. The overarching signal for OTHERS today is a heavy "Strong Sell," plain and simple. We’re sitting at a price of 171,510,546,013, which is down just over a percent at -1.194% from open. That’s a dip, sure, but it's the depth of the bearish sentiment that really stands out.
This isn't some weak, tentative 'sell' hint. The signal score is a dismal -69.9, suggesting a powerful conviction behind the downtrend. The two biggest simple moving averages are unequivocally bearish, too. The SMA 25 sits at 173,246,841,627.2, and the SMA 200 is way up at 241,555,922,494.57. Both of them are squarely in "Strong Sell" territory.
I remember one time I ignored the SMA 200 screaming bloody murder like this. Thought I was smarter than the long-term trend, piled into a position expecting a bounce. Got absolutely smoked. Ended up closing out that short at a substantial loss, watching the asset just keep grinding lower. This isn't theoretical; it happens.
But Then, The Green Shoots
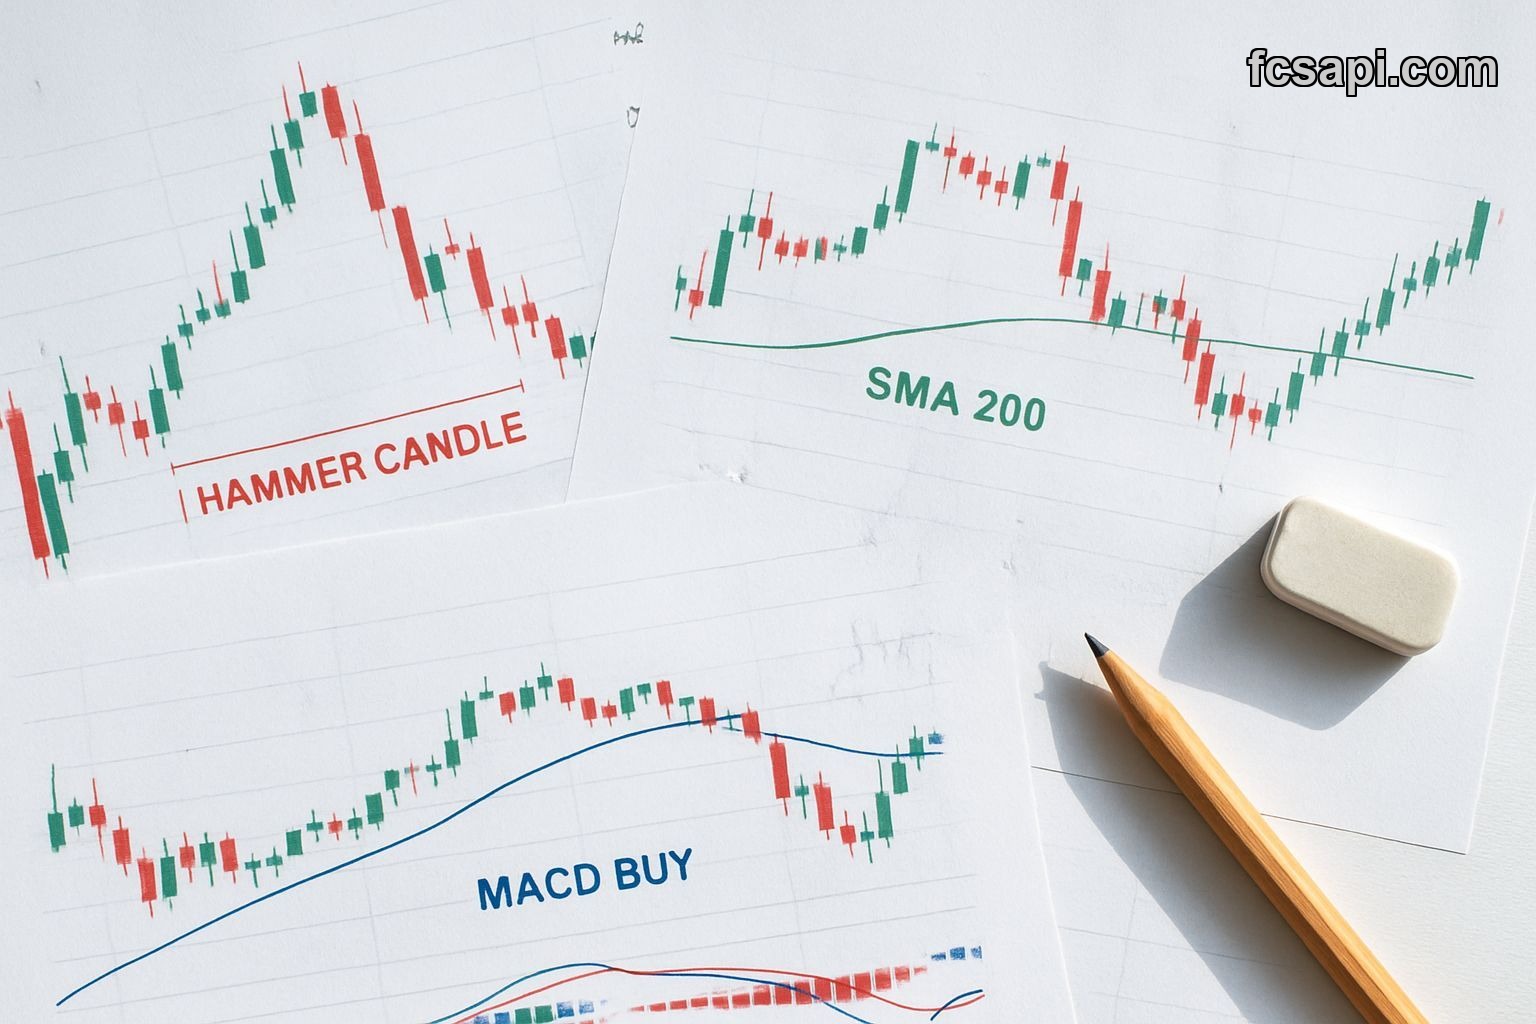
So you’ve got this wall of "Strong Sell" data, right? Your gut says run for the hills. But then you zoom in on the specific price action. That’s where things get weird. The asset's Price Action is currently labeled "Bullish." And to top it off, we've got a "Hammer" candle pattern. A hammer! That’s usually a bullish reversal sign, especially after a dip.
And it doesn't stop there. Look at the oscillators. The MACD Level is registering a "Buy" signal. The Stochastic K% is also flashing "Buy." Even the Ultimate Oscillator is neutral at 44.6649, not overtly bearish. How in the hell can you have a "Strong Sell" overall signal with fundamental elements like price action and key oscillators screaming the exact opposite?
It’s like your trading platform is suffering from multiple personality disorder. One indicator tells you to ditch everything, while others whisper sweet nothings about a coming rebound. I've had lucky breaks before because of this kind of conflict; sometimes those bullish candles in a sea of red are the real tell. Other times, they're just dead cat bounces, sucking in the hopefuls.
The Market's Mixed Message
This isn't just academic conflicting data. This impacts real money. The current valuation of OTHERS is 171,510,546,013. That’s well below the pivot points, both Fibonacci and Classic, which are centered around 173,935,154,155.33. We're also trading just above the S1 support levels, 170,305,694,562.35 for Fibonacci and 168,956,093,893.67 for Classic.
The distance from the All-Time High of 492,522,399,520.78 is staggering. We’re talking about an asset that’s lost more than half its peak value, yet it’s trying to catch a breath. The 1M Low was 149,665,845,128, so we are off the absolute bottom of the last month, but the recovery isn't exactly sprinting.
When you're trying to figure out if Crypto Total Market Cap Excluding Top 10, $ is a buy or sell right now, this is where the raw data from something like the FCS API really shows its mettle. It just presents the facts, no spin, no aggregation that smooths out the contradictions. You get to see the fight playing out in real-time, helping you form your own OTHERS price prediction for 2026, even if it’s a complicated one. To properly evaluate the larger trend, it's worth cross-referencing against other market indicators, maybe even looking at forex API data to spot broader capital flows.
What Does It All Mean? OTHERS Forecast 2026
So, where does this leave us for an OTHERS forecast for 2026? The overall 'Trend' is marked as "Strong," and combined with the "Strong Sell" signals from the moving averages, it points to a continuation of the bearish momentum, despite those hopeful candle patterns and oscillator buys. It tells me that any bounce is likely just that – a bounce within a larger downward move.
If the S1 support levels fail to hold, especially the Classic S1 at 168,956,093,893.67, then the bullish price action and hammer candle are likely just noise, a last gasp before another leg down. I’d be watching that level extremely closely. On the flip side, if those support levels hold and the bullish price action manages to push the price back above the pivot at 173,935,154,155.33, then maybe, just maybe, those buy signals have some teeth. It's a high-stakes gamble.
For me, the heavy moving average resistance and signal score mean the smart money isn't just ignoring this "Strong Sell." It's respecting it. You can grab all this complex, raw data to make your own calls through FCS API pricing plans, but you still have to interpret the chaos. So, when the market throws this much confusion at you, what do you even trust anymore?