
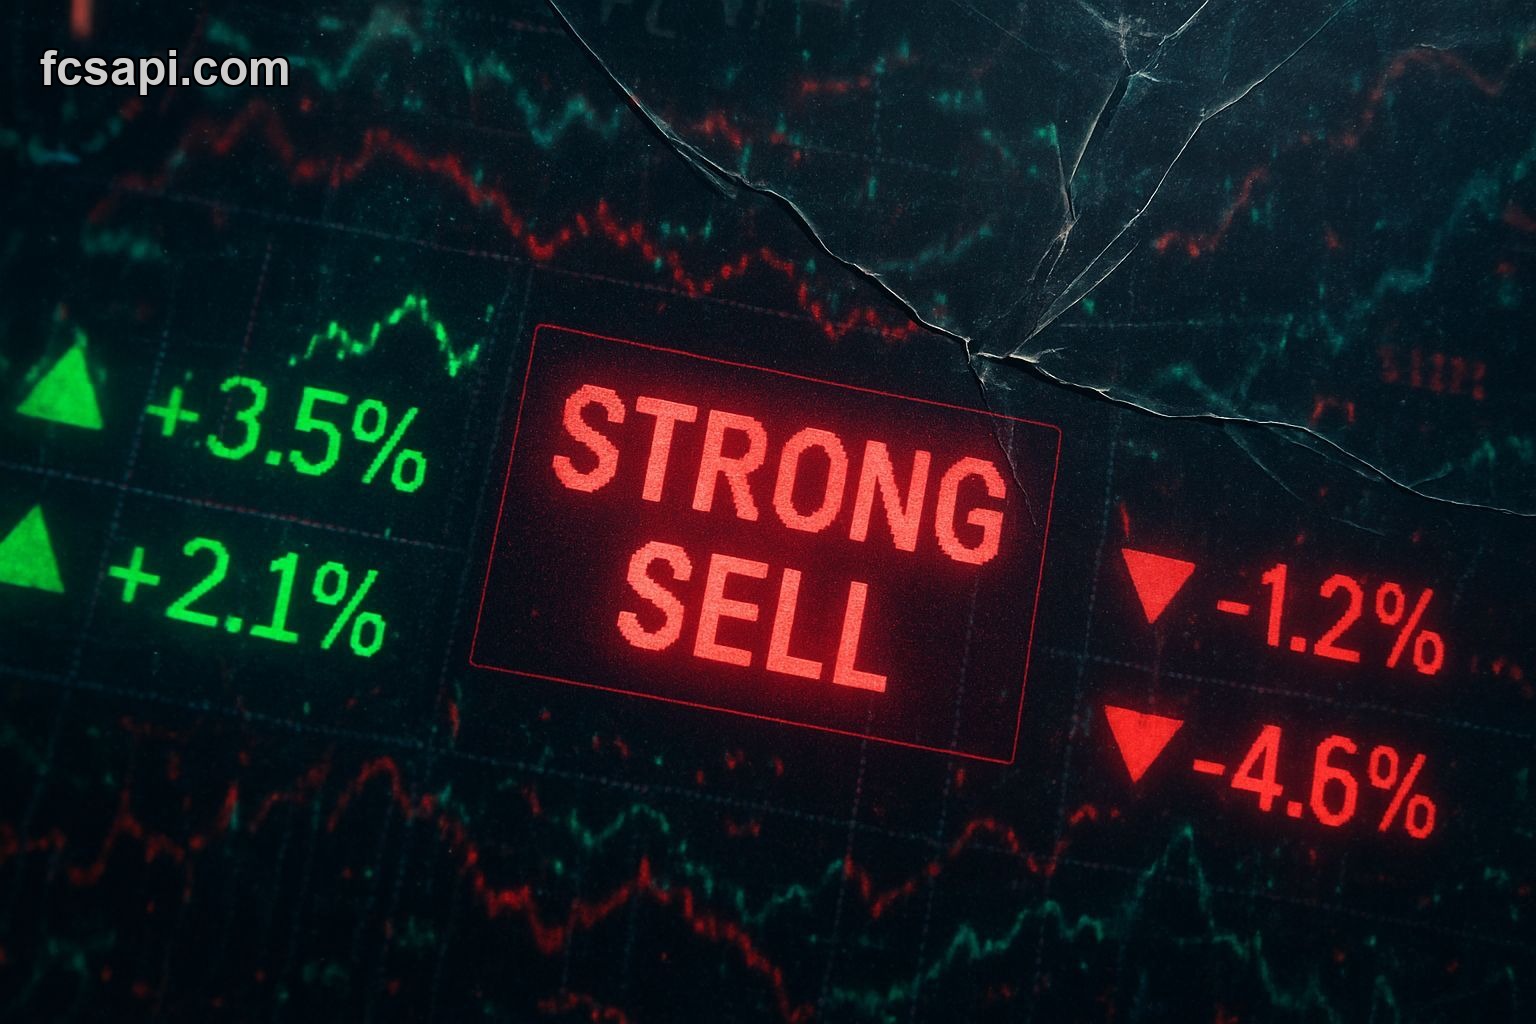
The market’s a weird place sometimes. You get a clear signal, and then you see something else entirely playing out. Right now, for Crypto Total Market Cap Excluding BTC and ETH, $ (TOTAL3), the main indicator is flashing a Strong Sell. Not just a casual "sell," but strong. Then you look closer, and the market's specific moves today? Apparent upward momentum.
It's February 24, 2026, and TOTAL3 is hovering around 686,668,311,383. The open was slightly higher at 687,423,757,230, which isn't a huge drop, but it is a drop. The whole picture screams "get out," but then there's that one little asterisk that makes you wonder if anyone actually knows what’s going on.
The Conflicting Signals: Strong Sell vs. Apparent Upward Momentum
You can’t make this stuff up. We're staring down a Strong Sell signal with a "High" confidence rating, meaning the models are pretty damn sure this isn't the time to be a hero. And yet, the market's "Price Action" is flagged as Bullish. What gives? Is it a last gasp? A final, desperate push before the inevitable? It sure feels like it sometimes.
Every trader worth their salt knows you don't fight the trend. And the trend here is flagged as Strong. Usually, strong trends combine with strong signals to tell you exactly where things are headed. But “Bullish” price action in the face of a "Strong Sell" with "High" confidence? That’s not a signal; that’s a Schrödinger's cat situation where the box is on fire.
This isn't just about one indicator squawking. We’re talking about a symphony of warnings. The overall change for TOTAL3 is a modest -0.11%, which almost masks the underlying fragility. But when you dig into the mechanics, it's pretty clear where the smart money, if it were following the book, should be heading.
Bearish Reality: The Weight of Evidence
Look, the numbers don't lie, even if the price action tries to tell a different story. Our oscillators are screaming. Stochastic K% is at 20.0636, a definite Sell. And Parabolic SAR? Strong Sell, sitting way up at 744,570,630,609.48. That's a huge distance from the current price, indicating a significant downtrend has been in play for quite a while now.
Then there are the moving averages, the workhorses of market analysis. Both are flashing big red warnings, a consistent drumbeat against any optimism. Current price is well below both of those. Way, way below the 200-day average. That’s not just a bad day; that's a longer-term structural problem that screams systemic weakness, not a temporary blip.
| Indicator | Value | Signal |
|---|---|---|
| SMA 25 | 714,924,105,900.68 | Strong Sell |
| SMA 200 | 933,081,759,092.2 | Strong Sell |
Let’s not forget performance. TOTAL3's 6-Month Performance is down a brutal -34.1214%. Thirty-four percent gone in half a year. That's not a healthy asset. That kind of loss shakes confidence to its core, and it doesn't just disappear overnight. This kind of sustained pressure makes any "bullish" price action feel more like a momentary hiccup in a larger downward trajectory, not a genuine reversal of fortune.
What's "Bullish" Even Mean Here?
So what in the actual market is that "Bullish Price Action" supposed to signify when everything else points south? One possibility is it's a short-term bounce, a tiny relief rally on a longer downtrend. It’s what some might call a dead cat bounce, where even the most beaten-down assets can show a flicker of life before continuing their descent. The market loves to toy with expectations, suckering in the hopeful.
Another angle could be that this seemingly bullish move is just reflecting a momentary uptick in buying pressure that doesn't hold any real weight. With the current price so far removed from critical resistance levels, and the 1M Low at 642,096,341,701 not too far off, this "bullishness" could just be a retest before breaking lower. It’s a trick the market plays to liquidate late shorters or draw in new retail money just before another leg down.
The volatility here is also High, with an ATR% of 3.8222. High volatility means bigger swings, which can create seemingly bullish candles or bursts of buying even within a strong downtrend. It’s not necessarily a sign of strength, but more a sign of, well, chaos. And chaos makes it tough to rely on single data points. This kind of environment needs constant monitoring, the kind you get with robust data feeds. Check out the crypto API documentation for how to stay on top of these wild swings.
Navigating the Current Mess: Support and Resistance
Given the volatility, those pivot points become even more crucial. For Fibonacci, our current price is sitting just below the pivot point of 691,762,945,323.67. The first support, S1, is 681,532,810,261.47. Breaking that would open the door for more downside, maybe even a retest of the 1M low, which is a chilling prospect for anyone holding bags right now.
Camarilla pivots tell a similar story, with the pivot point at 687,727,118,645. Again, current price is just below it. The S1 for Camarilla is 685,272,243,302.85. It's all very close. These levels aren't strong walls; they're more like speed bumps on a downhill slope when momentum is strong against you. Any hint of upward movement near these levels has to be taken with a heavy dose of skepticism, especially when the larger trend is clearly against it.
This market environment is a masterclass in why you can't just pick one indicator and run with it. If you went purely on that "Bullish Price Action" for TOTAL3, you'd be missing a whole lot of very loud alarms going off. It's about synthesizing these signals, understanding when one piece of data is an anomaly, and when it's genuinely trying to tell you something different. This situation feels like the former. Want more takes like this? Head over to the FCS API blog for ongoing analysis.
The market has a way of testing conviction, especially when it throws out conflicting data. That -34.1214% over six months isn’t going to magically vanish because of some momentary perceived strength. Unless there’s a massive catalyst, something genuinely game-changing, this market, despite its little feints, looks set to continue its downward trajectory. It’s a prime example of how crucial it is to get reliable, comprehensive data that cuts through the noise and presents the full picture, even the confusing parts. Otherwise, you’re just guessing, and guesswork in this kind of volatile environment means losing big. The predominant indicator, backed by practically everything else, is the real story here. Don't let a flicker of apparent upward movement blind you to the overwhelming

