

Gold teased $5000 this morning and couldn't hold it. Opened at 4995.6, closed at 4918.57 — down 1.54% on the day. That's the third time in two weeks we've knocked on that door and walked away.
The signal still says buy. Score of 35.2, which isn't screaming confidence but isn't bearish either. Price action is flagged as bullish despite the drop. That disconnect is what keeps me up at night — technicals pointing one way, price doing another.
The Moving Averages Tell One Story
Every major moving average is screaming strong buy. The 100-day SMA sits at 4341, the 200-day EMA down at 3977, the 100-day EMA at 4384. We're trading nearly $600 above the nearest one. That's cushion.
I've been long gold since it broke 4200 in December. That trade is up big. Six-month performance shows 46.75% gains. But that's also why I'm nervous — when something runs this far this fast, pullbacks hurt more than they should.
The ADX at 23.74 gives a strong buy reading. That measures trend strength, and anything above 20 usually means the trend has legs. But we're not at 25 yet, which is where I really start trusting it. We're in that gray zone where things can flip fast.
Oscillators Are Worthless Right Now
RSI sitting at 51.91 — neutral. Not overbought, not oversold, just sitting there giving us nothing. The ATR at 200.95 says buy, but ATR doesn't tell you direction. It just says volatility is high enough to make moves, which we already know because ATR percentage is sitting at 3.98%. High volatility, no clear direction from momentum indicators.
This is where I hate trading. When oscillators go quiet and price is whipping around, you're flying blind. The Bollinger Bands show we're at 57.52% position with the middle band at 4911.5. We're slightly above center but not stretched. Normal squeeze, which means no compression breakout coming soon.
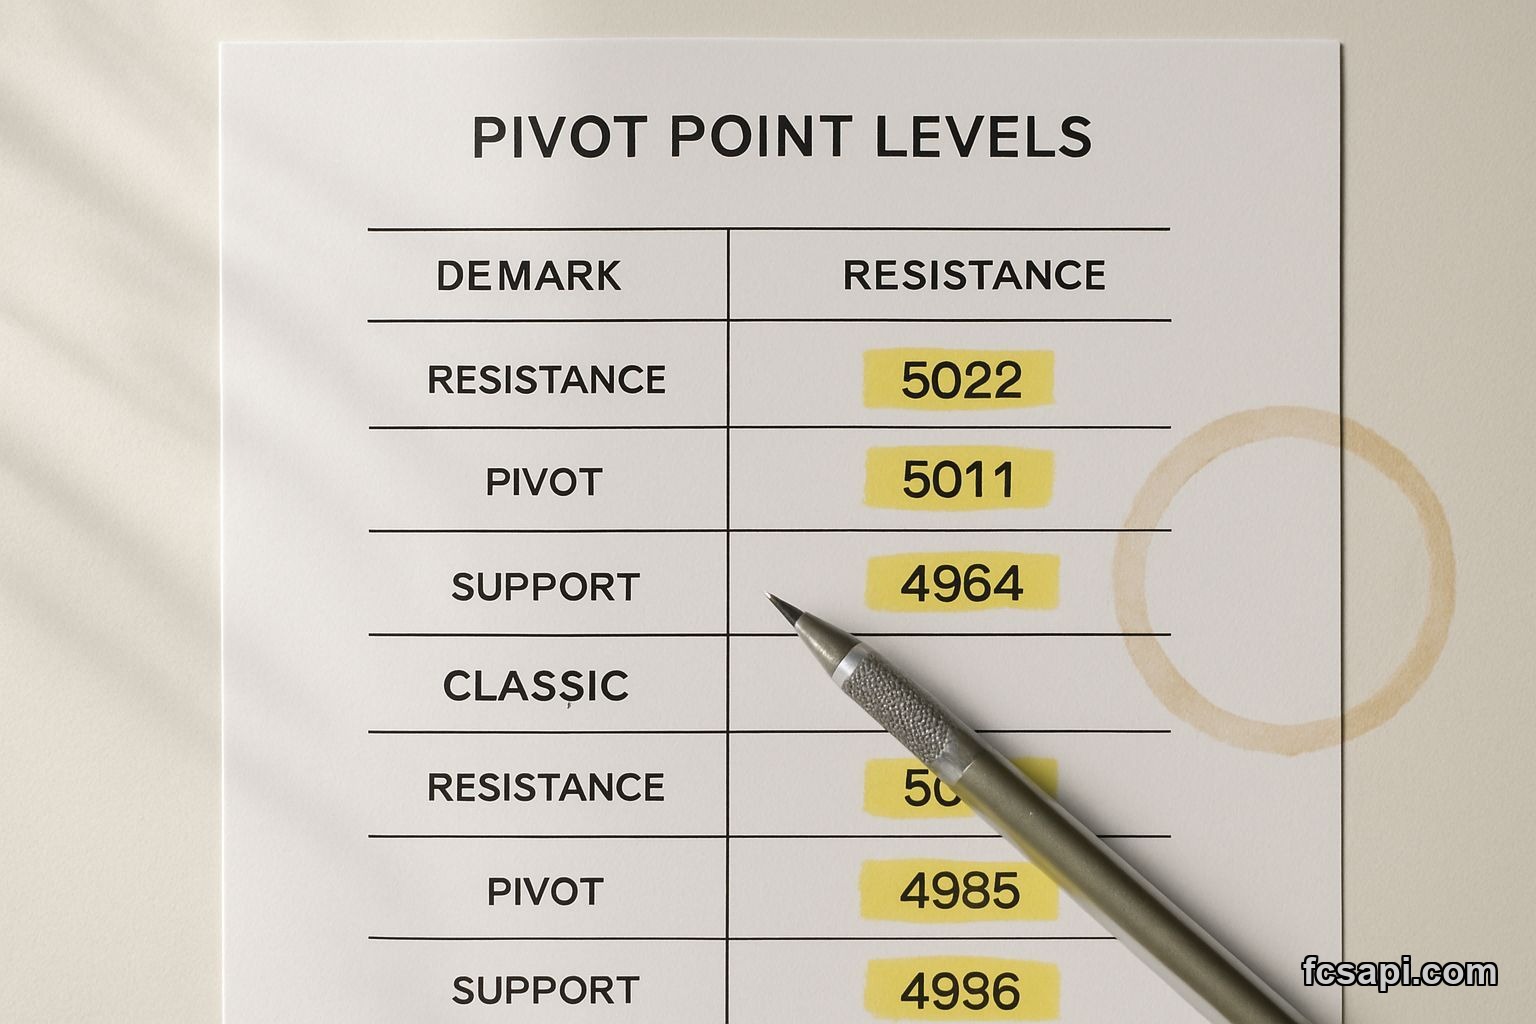
Pivot Points Say Watch 4964
Demark support is at 4964.45. We closed below it. That's the first red flag today. If we can't reclaim that level tomorrow, we're probably heading to classic support at 4937.17. That's where I'd look to add if I wasn't already fully positioned.
Resistance sits at 5124 on Demark, 5096 on classic. That 5100 area is the real fight. We need to break it with volume or this rally is stalling out. I've watched enough failed breakouts to know that hesitation at round numbers usually means more consolidation.
The Week Performance Matters More Than Today
One-week performance is down 2.83%. That's a bigger deal than today's 1.54% drop because it shows momentum shifting. We had a strong January, first week of February was solid, then we started chopping. The six-month number is still impressive but that's backward-looking.
- Gold opened above $5000 for the first time
- Couldn't hold it through the session
- Closed below Demark support
- Weekly trend now negative
I'm not panicking but I'm watching closer. The all-time low at 20.54 is meaningless ancient history, but it reminds you how far this thing has run. We're 239 times higher than that low. Doesn't mean we can't go higher, just means corrections hurt when they come.
What I'm Doing With This
Holding my position but not adding here. The forex API data I pull through FCS API refreshes every few hours and I'm tracking that 4964 level like a hawk. If we reclaim it and hold above for two sessions, I might add a small piece.
The buy signal feels late. It's giving us a green light after we've already run from 4300 to 4900. That's the problem with lagging indicators — they confirm what happened, not what's coming. The strong buy readings on moving averages are true but they're also telling us we're extended.
My worst trade last year was chasing gold at 3800 thinking it couldn't go higher, watching it rip to 4100, then panic-buying at 4050 only to see it pull back to 3900. I learned then that these big moves need time to breathe. This feels similar.
The 2026 Picture
If gold holds 4900 through February, we're probably heading to 5200 by March. That's based on nothing but the pattern of higher lows we've been printing since October. Each pullback finds support about $300-400 higher than the last one. Simple stuff.
But if we break 4900 and lose 4850, we could see 4600 faster than anyone expects. That's a 6% drop from here, which sounds small but on a position size that matters it's real money. The currency converter tools I use show gold's been moving $50-100 a day lately. That's enough to wreck you if you're on the wrong side with size.
I pulled some data through FCS API this morning comparing gold's current setup to the last three times we had this technical picture — strong buy on moving averages, neutral RSI, price making new highs then immediately pulling back. Two of those times we consolidated for three weeks before the next leg. One time we dropped 8% in five days.
The pricing on forex data access is cheap enough that I run multiple feeds now. Helps catch divergences between spot and futures that sometimes signal where the big money is positioning.
My Take
We're in a bull trend that's getting tired. The signals haven't flipped bearish but they're not enthusiastically bullish either. This is where discipline matters more than conviction. The trade is working, the technicals support higher prices long-term, but short-term we need to prove we can hold $5000.
I'm not selling but I'm not adding. If you're not in yet, waiting for a clearer setup makes sense. If you are in, maybe trim a bit if we get back above 4990 and lock in some gains. The six-month run has been incredible but nothing goes straight up forever.
Will gold finally break and hold $5000, or are we setting up for a deeper correction back to 4700?

