
February 16, 2026, and EUR/NOK just slapped us with a "Strong Sell" signal, the price now sitting at 11.2592 after opening higher at 11.301. That's a -0.37% move down. You'd think that's a clear-cut sign to bail, right?
But the market, as always, isn't that simple. High confidence in a strong sell signal, yet beneath the surface, there's a serious split developing. It’s enough to make you question everything you thought you knew about EUR/NOK (OANDA EU Clients) analysis.
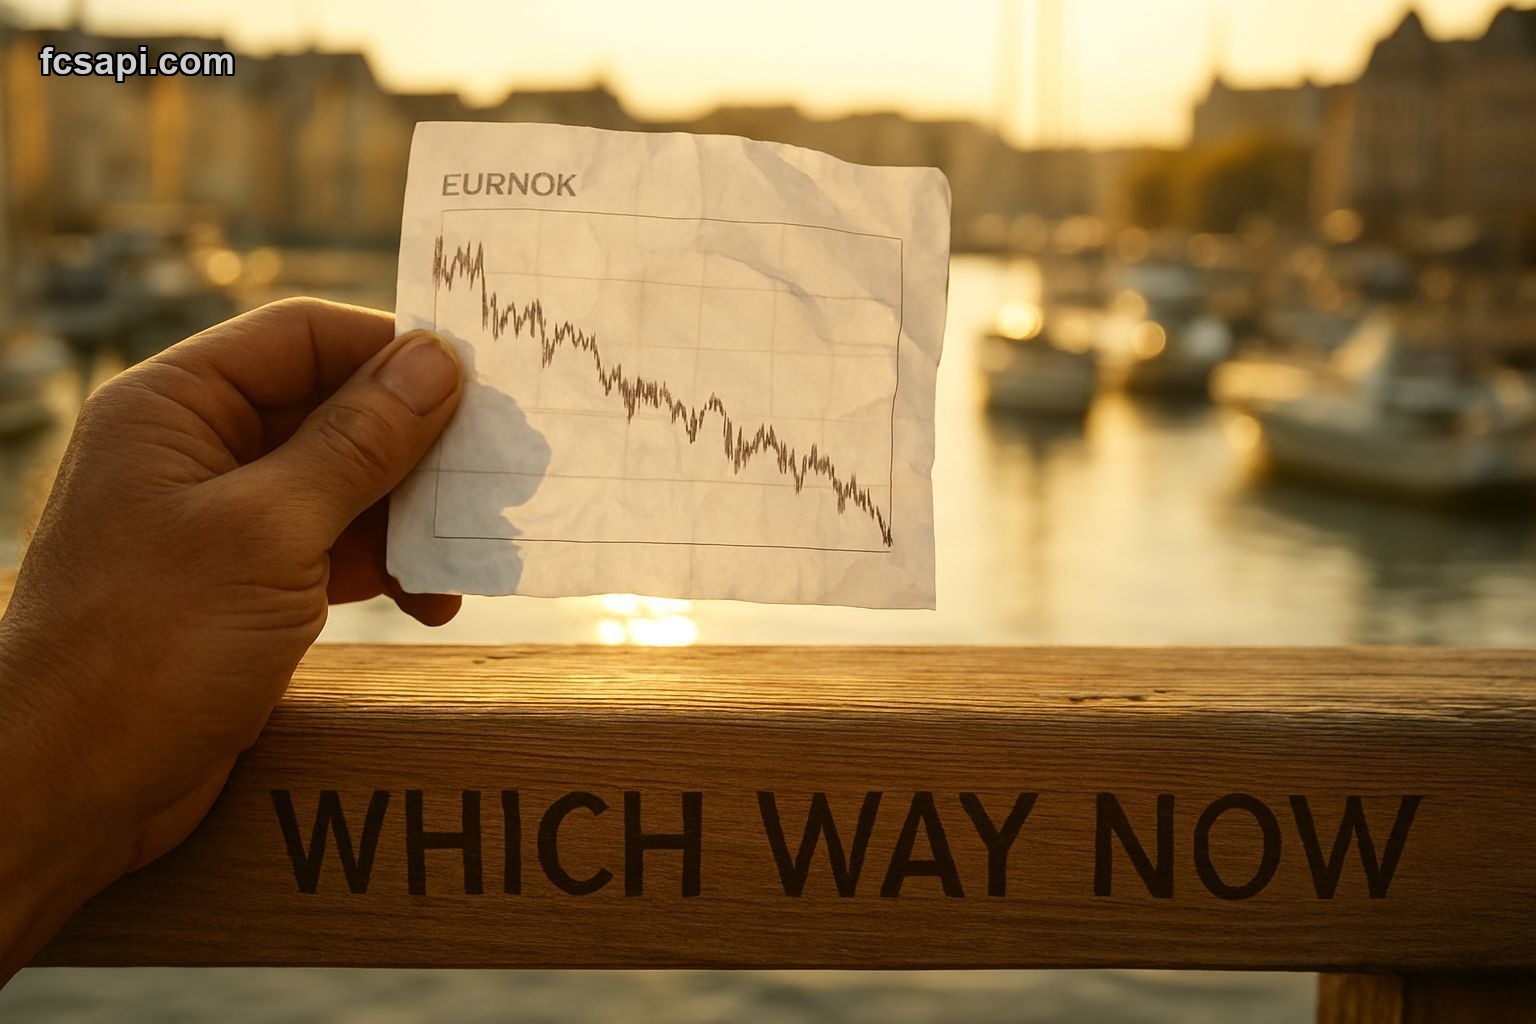
The Bull-Bear Tug-of-War
On one hand, the dominant signal screams "Strong Sell" with a frightening score of -90.8. The trend? Moderate, but certainly not upwards. This isn't just a flicker; it's a solid, confirmed downtick for EUR/NOK, eroding value pretty consistently over the last six months, dropping -5.99783% in that period.
However, dig into the oscillators, and things get weird. RSI is showing 32.7746, flashing a "Buy" signal. ADX, usually a pretty good gauge of trend strength, is even more bullish at 23.0844, signaling a "Strong Buy". It's like two separate markets are arguing over the same asset.
So, for anyone trying to figure out if EUR/NOK (OANDA EU Clients) is a buy or sell right now, this is a head-scratcher. Your overarching market signal says one thing, but two key momentum indicators are shouting the opposite. That kind of divergence doesn't happen every day and demands closer inspection.
Big Picture Trends vs. Short-Term Blips
Looking at the bigger picture, the moving averages tell a familiar story of bearish sentiment. Both the SMA 200 and EMA 100 are well above current price, both indicating "Strong Sell". This isn't a surprise given the recent performance, and it underscores the longer-term slide EUR/NOK has been on.
The SMA 200 at 11.7025 and EMA 100 at 11.6348 act as significant resistance levels. The current price of 11.2592 is nowhere near challenging those. This paints a grim outlook for EUR/NOK (OANDA EU Clients) forecast 2026, suggesting the bears have been in control for a while, and breaking this trend won't be easy.
When you're dealing with such a clear bearish bias from the long-term averages, those "Buy" signals from RSI and ADX feel less like a reversal and more like a potential bounce in a downtrend. Or, maybe it's just exhaustion. It's tough to tell without context beyond these numbers, but ignoring the longer-term sentiment is usually a rookie mistake.
The Indecision at the Pivots
The price action itself offers little clarity for EUR/NOK (OANDA EU Clients) price today. We're seeing a Doji candle pattern, which is essentially indecision. The open and close prices are very similar, signaling that neither buyers nor sellers truly won the day, despite the overall price decline.
Even more compelling, this Doji sits right at a critical juncture. The Woodie and Camarilla pivot points, R1, S1, and P, are all clustered tightly at 11.2808. The current price of 11.2592 is just barely below these pivotal levels. It feels like the market is holding its breath.

This is where things can get interesting. A Doji at these levels after a significant drop, with conflicting oscillator signals, could set up for a volatile move. Is it a brief pause before another leg down, or is it a floor forming? History tells us to be wary when the market is this undecided, especially with such a strong sell signal still in play. For reliable, real-time data like this, the FCS API offers comprehensive feeds, helping you track these nuanced movements.
A Dive into the Data Points
Let's lay out some of the crucial numbers we're dealing with today:
- Price: 11.2592
- Signal: Strong Sell (Confidence: High, Score: -90.8)
- Change Today: -0.37%
- RSI: 32.7746 (Buy)
- ADX: 23.0844 (Strong Buy)
- SMA 200: 11.7025 (Strong Sell)
- EMA 100: 11.6348 (Strong Sell)
- Pivot (Woodie/Camarilla): 11.2808
- 6M Performance: -5.99783%
- All-Time Low: 9.4326
The contrast here is stark. A short-term bounce suggested by oscillators, but overwhelmed by longer-term moving averages and a dominant "Strong Sell" overall signal. This doesn't scream a straightforward EUR/NOK (OANDA EU Clients) prediction for the next few days, let alone an easy one.
For more detailed breakdowns and to access historical data that puts these signals into perspective, checking out the FCS API blog can offer further insights. It’s crucial to layer this kind of real-time market data with broader context to make truly informed calls.
My Honest Take on EUR/NOK
Look, if you're asking me what to do with EUR/NOK (OANDA EU Clients), the picture today, February 16, 2026, is murky despite that loud "Strong Sell" signal. The core signal has high confidence and the price action supports the recent downtrend. We've seen a pretty consistent decline, reflected in that -5.99783% over six months.
However, you simply cannot ignore the "Buy" and "Strong Buy" calls from RSI and ADX. Those are significant indicators, even if they're contradicting the main flow. What this tells me is not necessarily a bullish reversal, but possibly a very short-term bounce or a temporary bottom before deciding its next major move. This Doji at the pivots confirms the hesitancy.
For me, this screams "stay on the sidelines" for now unless you're a seasoned scalper thriving on intraday volatility. The risk-reward for taking a big position here based on such conflicting signals just isn't there. Watch those pivot levels, see if it breaks decisively above or below 11.2808. Until then, it's a waiting game. These kinds of contradictions are what make forex trading a real challenge, but also where the biggest opportunities sometimes lie for those with patience.

