
$355.28. That's where Tesla closed today, down 2.89% from the open. The signal score? -95.9. Strong Sell. But here's the weird part — price action still reads bullish even as every moving average screams exit. I've been tracking this with FCS API for weeks now and the divergence is getting uncomfortable.
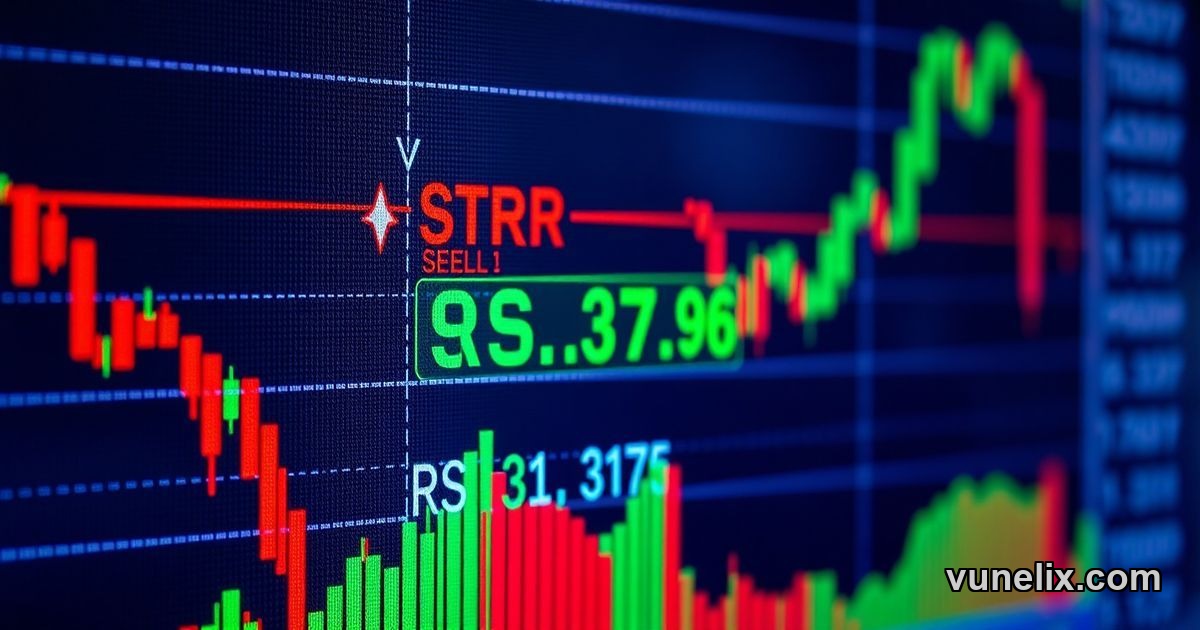
Most traders I talk to are confused. They see RSI at 31.75 (oversold, technically a Buy), ADX at 27.4 (Strong Buy on momentum), and they think "bottom's in, time to load up". Then they look at the SMA 200 sitting at $396.21 and the 10-day at $377.94 — both miles above current price — and realize they're catching a falling knife. AI trading tools are built for exactly this mess. You filter thousands of US stocks in real-time, check fundamentals against technicals, and see which signals actually matter when everything contradicts.
Tesla, Inc. Price Today: The Numbers That Matter
Opening at $365.86, Tesla dropped over ten dollars intraday. That's not noise. ATR (Average True Range) is 13.60, which means volatility is real but not extreme. The 1-month range tells the bigger story: low of $352.14, high of $416.38. We're sitting $3 above the monthly low right now.
Camarilla pivot points put resistance at $362.78 (R1) and support at $360.87 (S1). Fibonacci resistance hits $367.68. All of these levels? Above current price. That's the problem. Bulls keep trying to defend $355, but there's no obvious floor until you go back to that $352 monthly low. And if that breaks, what's underneath?
Oscillators Say One Thing, Moving Averages Say Another
ADX at 27.4 means the trend has strength. RSI under 32 is oversold territory. ATR confirms we're in a tradeable range. On paper, these are buy signals. But the -95.9 composite score isn't pulling that number from thin air. SMA 200 is $396. SMA 10 is $377. Both say Strong Sell. When short-term and long-term averages both sit above you, rallies are usually just dead cat bounces.
I took a small loss on TSLA two weeks ago because I ignored the SMA 200. Thought the RSI dip would reverse faster. It didn't. The averages dragged price down like gravity. That's the lesson: oscillators can flash Buy all day, but if you're trading below major moving averages, you're swimming upstream.
Tesla, Inc. Buy or Sell: What the -95.9 Signal Means
Strong Sell with a -95.9 score isn't a suggestion. It's a red flag. I've seen plenty of stocks recover from worse, but they don't do it in a straight line. They chop, they retest, they flush out weak hands first. Right now Tesla has bullish price action — meaning the candlestick patterns and momentum look okay on a micro level — but the macro trend is down. That's the disconnect.
Some traders love this setup. They'll buy here, set a tight stop at $352, and hope for a bounce to $367 (Fibonacci R1). Risk-reward looks decent if you're quick. But if you're holding longer than a few days, you're betting against the signal score, against both moving averages, and against the overall trend. That's a lot of resistance.
Tesla, Inc. Forecast 2026: Can This Reversal Hold?
March 31, 2026. We're already a quarter into the year. If Tesla wants to reclaim the SMA 200 at $396, it needs to gain $41 from here. That's an 11.5% move. Not impossible, but it needs a catalyst. Earnings? Product launch? Macro shift? Something. Right now the chart says "show me".
The 1-month high of $416 feels like ancient history. That was less than 30 days ago. Now we're testing the monthly low. The speed of this drop — from $416 to $355 — is what makes the Strong Sell score so heavy. Fast drops often mean more downside before a real base forms. Slow drops you can trade. Fast ones, you wait.
Tesla, Inc. Support and Resistance Levels
Support: $360.87 (Camarilla S1) is the first line. Break that and you're testing $359.75 (Fibonacci S1), then the monthly low at $352.14. Below $352, there's not much on the chart until you go back weeks.
Resistance: $362.78 (Camarilla R1) is immediate overhead. Then $367.68 (Fibonacci R1). After that, the SMA 10 at $377.94 is the real test. If Tesla clears $378, the narrative changes. Until then, every rally is a potential short setup for swing traders.
How AI trading tools Handle This
You're not sitting here with a calculator. Vunelix pulls every US stock, filters by signal score, compares fundamentals in real-time USD pricing, and shows you which names have clean setups vs. messy ones like this. When Tesla's oscillators say Buy but the signal score is -95.9, you need more data — sector rotation, peer performance, volume trends. The platform sorts all that without you opening ten tabs.
Tesla, Inc. Analysis: Divergence Between Price Action and Signal
Bullish price action with a Strong Sell signal is rare but not unheard of. It happens when momentum (ADX, RSI) and structure (moving averages) disagree. Momentum says "we're oversold, bounce coming". Structure says "trend is down, sell the rip". Both can be right on different timeframes.
For day traders, the RSI at 31.75 might be enough. They're in at $355, out at $362, done in a session. For position traders, the SMA 200 at $396 is a brick wall. You don't fight that unless you've got a really good reason. I don't see one today.
Tesla, Inc. Target Price: Where Does This Go Next?
Downside target: $352 retest seems obvious. If that fails, you're looking at low $340s based on prior support zones (not shown in today's data, but that's where gaps sit from earlier moves). Upside target: $367 on a bounce, maybe $378 if the SMA 10 gives way. But that SMA 200 at $396? That's the boss level. You don't clear that without real buying pressure.
The signal score at -95.9 suggests the path of least resistance is still down. Not a crash, not a capitulation — just a grind lower until something changes. Could be a week, could be a month. The market doesn't care about your timeline.
Tesla, Inc. Outlook: What I'm Watching
I'm not trading this until the signal score moves or the SMA 10 flips. Right now it's a coin flip dressed up as a trade. The bulls have RSI and ADX on their side. The bears have both moving averages and the composite score. When the data splits like this, the smart move is to wait for confirmation.
If Tesla breaks $352, I'm watching for a flush to $345 or lower. If it reclaims $367 and holds, maybe the bottom's in. Until one of those happens, this is a stock you track, not a stock you trade. FCS API data updates fast enough that you'll catch the turn when it happens. No need to guess.
Explore more tools and market data on FCS API.