

Today, March 11, 2026, Gold / U.S. Dollar price sits at 5189.17. Seems straightforward, right? Well, not so fast. Anyone glancing at the raw signals might think it's time to go all in, given the loud 'Strong Buy' flashing on more than one indicator. But scratch the surface, look at the other bits, and you realize something's off. There's a catch, a quiet whisper beneath the bullish roar.
I’ve seen this before. You get a barrage of positive signals, the kind that make you feel like a genius before you even click the button. Trouble is, those signals often paint a picture that's already fading, or worse, they hide a crucial piece of the puzzle. Today, the puzzle piece missing for many, the one they'll scroll right past, is that "Weak" trend classification.
The False Cheer of Strong Buy Signals
Let's be blunt: the immediate data for GOLD / U.S. DOLLAR looks like a green light across the board. The Parabolic SAR is screaming 'Strong Buy' with a value of 5014.8. And if you like your moving averages, they're all in unison. The EMA 100 sits at 4594.22, the SMA 200 at 4012.76, and the SMA 100 at 4535.01—every single one of them pointing to a 'Strong Buy'. That’s a lot of confirmation for the bulls out there.
You’d think with all that backing, we'd see some serious movement today. A strong upwards push, clear momentum. The price action even confirms it, tagged as 'Bullish'. Seems like the market's all dressed up and ready to go for Gold, doesn’t it? This kind of blanket bullishness makes people complacent, makes them skip the finer print.
This is where disciplined data analysis comes in handy, where you don't just take the headline. When you get this much enthusiasm, it's usually time to look for the cracks. These powerful signals often represent past performance, past price movements that got us to this point. They're good at telling you where you've been, less so where you're going right now.
The Red Flags Nobody Talks About
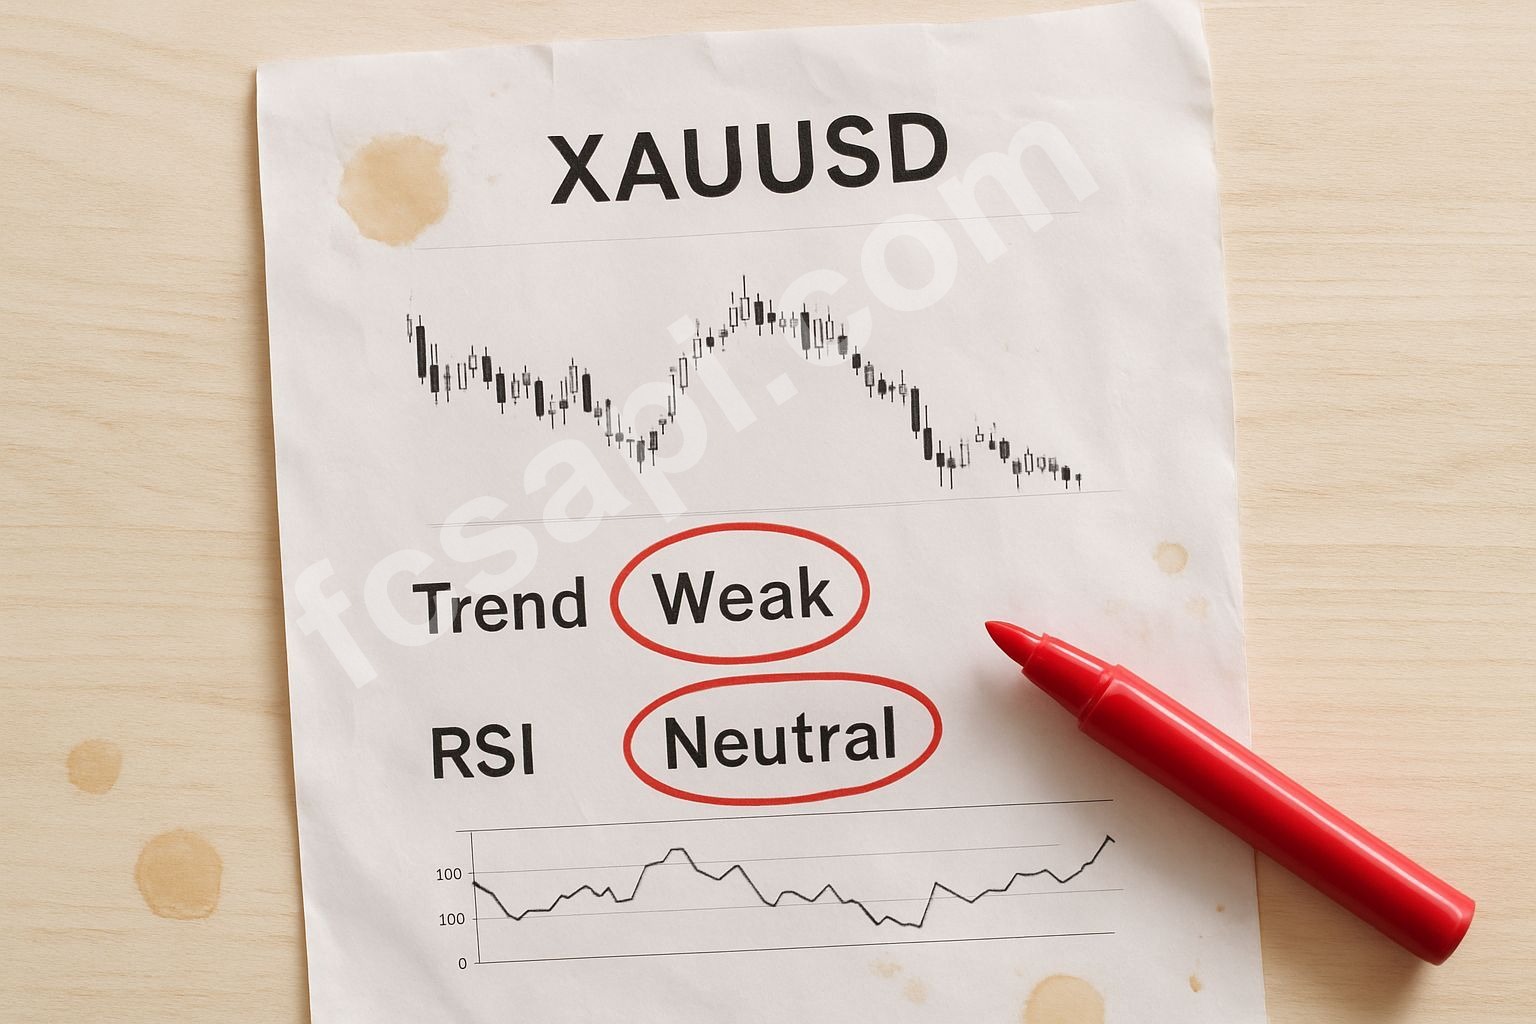
Here’s the gut punch: for all those 'Strong Buy' calls, the overall trend for GOLD / U.S. DOLLAR today is simply rated as 'Weak'. How do you reconcile that? A cacophony of 'Strong Buy' signals, yet the underlying current is barely there. It's like a sprinter with all the right gear, great form, but running through mud. The enthusiasm is theoretical, not practical, in this exact moment.
And then there's the RSI. At 55.6875, it's firmly 'Neutral'. Not overbought, not oversold, just… floating. It means there’s no immediate pressure building up from that angle. It contradicts the high-fives from the MAs and SAR. If a true strong buying trend was in full swing, you'd expect to see the RSI pushing higher, showing sustained buying pressure, not just sitting in the middle.
Let's also talk about the actual change today. The price moved by a measly +0.041%. That's it. For all the 'Strong Buy' signals, that tiny blip tells you something vital: the market isn't exactly buying into the hype with conviction. When you're supposedly in a 'Strong Buy' scenario, you don't usually see such a muted reaction from the price itself. It smells like a trap, plain and simple.
Volatility vs. Actual Movement
The market's high volatility for Gold today, measured by an ATR% of 3.0268, is another layer to this confusing picture. High volatility often means bigger swings, but when combined with such a small net change, it implies chop. A lot of back and forth, but not much directional commitment. You’re seeing big price fluctuations within the day, creating noise, without a clear winner by closing.
This kind of environment chews up stop losses and burns through patience. High volatility paired with a 'Weak' trend and a neutral RSI is a trader's nightmare. It’s a market pretending to be busy without actually doing anything meaningful. It can create false breakouts and suck people into moves that immediately reverse. Don't be fooled by the theatrics; focus on the underlying story. If you need robust data to make sense of this kind of chaos, exploring the forex API documentation can give you the deeper dive you need.
| Type | Resistance 1 (R1) | Pivot Point (P) | Support 1 (S1) |
|---|---|---|---|
| Classic | 5247.52 | 5182.62 | 5126.61 |
| Fibonacci | 5228.80 | 5182.62 | 5136.43 |
Look at those pivot points. Our current price of 5189.17 is hovering right around the Pivot Point (P) of 5182.62 for both Classic and Fibonacci. It’s like Gold is standing right on the fence. It hasn't decisively broken R1 or S1 yet, which supports the idea of this being a market struggling for direction despite the 'Strong Buy' hype. A truly strong trend would have seen it burst through R1 or tested S1 with conviction.
The 2026 XAUUSD Outlook: My Honest Take
The 6-month performance for GOLD / U.S. DOLLAR is impressive, a 42.9417% gain. No doubt, Gold has been a strong performer leading up to this point, climbing significantly from its all-time low of 20.54. And the current price is a good distance from the 1-month high of 5419.32, which might suggest there’s still room to run for those thinking long-term.
But for March 11, 2026, and looking at the immediate future, I'm bearish on the 'Strong Buy' signal narrative. This isn't a confident rally; it’s a tug-of-war disguised as an open road. When you see this level of contradiction—powerful lagging indicators screaming 'buy' while leading indicators and actual price action whisper 'weak' and 'neutral'—you don't jump in. You wait.
The prudent move here, if you're not already in, is patience. Let the dust settle. Let the market decide if it wants to commit to the bullish story or if it's going to slide back down to test those support levels. Getting clear, reliable market data from an FCS API setup is crucial for navigating these mixed signals. Trying to guess in a volatile, weak-trending market is a recipe for regret. Check out our other forex articles for more insight on managing these situations.
This kind of conflicting data is why you can't just follow one indicator or one type of signal. You need to look at the full picture, even the parts that don’t immediately jump out at you. If you’re building models, don't let a handful of 'Strong Buy' signals cloud your judgment when other parts of the picture are telling a different story. If you're serious about your data streams, perhaps consider the API pricing plans.

