
XRP sits at 1.4227 today, February 20, 2026. Up a tiny bit from its open at 1.4063, a positive change of 1.166% on the day. Nice, right? Don't be fooled by that surface-level green.
The system is screaming "Sell" and frankly, I'm listening. When almost every indicator points to one direction, even a slight upward tick during the session doesn't change the underlying reality. You ignore the bigger picture at your own peril, especially in this market.
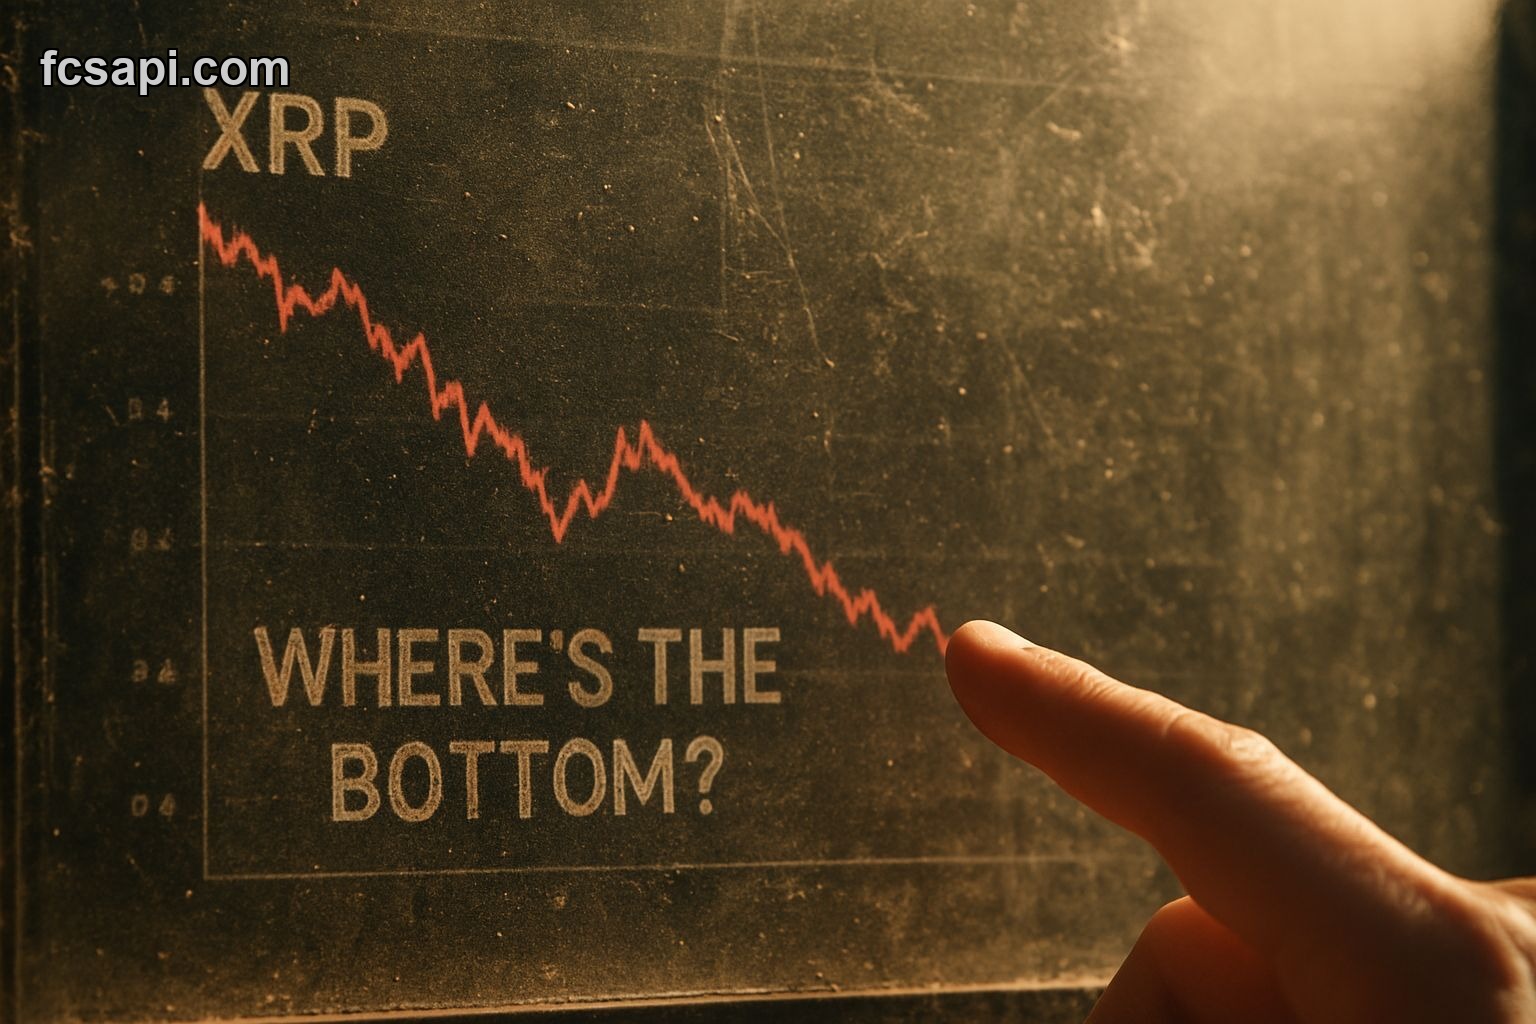
XRP's Flashing Red Signal
The overall signal for XRP today is a definitive Sell. No ambiguity there. The confidence behind that call is High, and the Signal Score clocks in at a bearish -54.
That score alone tells you most of what you need to know. It's not a gentle suggestion; it's a strong indicator of downward pressure, despite a short-term price action tagged as "Bullish." Call it a dead cat bounce, call it a head fake, call it whatever you want, but the strong undertow is there.
I've seen these little blips before. You get a slight rally, everyone thinks the bottom's in, and then you wake up to another nasty drop. You have to look beyond the immediate intraday change for the real pulse of an asset. And right now, XRP's pulse is weak.
Moving Averages Scream Danger
This is where the real story unfolds. The moving averages paint a grim picture for XRP, suggesting significant resistance overhead. Every single one is a "Strong Sell," and the current price is a long way off from them.
- EMA 25: 1.53748 (Strong Sell)
- EMA 100: 1.89865 (Strong Sell)
- EMA 200: 2.1153 (Strong Sell)
Look at those numbers. XRP at 1.4227 is trading significantly below its 25-day, 100-day, and 200-day exponential moving averages. That's not just a warning; that's a full-blown siren blaring "run for cover." It shows sustained weakness and a clear long-term downtrend.
Trying to fight that kind of trend is like swimming against a tsunami. You might make a tiny bit of progress for a moment, but eventually, you're getting swept away. The fact that the EMAs are so far above the current XRP price today tells me this market has bled out for a while, and the sellers are very much in control.
Forget trying to catch the falling knife here. There's simply too much overhead resistance for any sustainable upward move in the short to medium term. The technical setup is brutal, plain and simple.
Short-Term Blips in a Bear Market
Now, to be fair, there are some conflicting signals, but they're largely outweighed by the bigger picture. The MACD Level, for example, shows a "Buy" at -0.0932. It’s thin, sure, but it's there. Stochastic K% on the other hand, at 43.8847, points firmly to a "Sell," aligning with the broader narrative.
The system flagged "Price Action" as Bullish today, which is what gives us that slight daily gain. But that's a small victory in a much larger war. You can't let a single positive price action print overshadow the overwhelming bearish sentiment from the moving averages and the overall signal. This is why you need a comprehensive view, not just fragments.
For me, the Fibonacci Pivot Points for the day show XRP sitting just below R1 at 1.42958. Its main pivot point is 1.40853. We're grinding against immediate resistance. Can it push through? Maybe for a moment. But then what? You still have those massive EMAs looming overhead. If you're using something like the FCS API to pull this data, you'll see how often these momentary pushes fail against stronger, longer-term indicators. Check out the crypto API documentation to see what I mean about getting real-time insights.
Where We've Been, Where We're Going
Looking at performance over the last month really emphasizes the pain. The 1M High for XRP was 1.9656. We're at 1.4227 now. That's a serious haircut. The 1M Low was 1.1188. While we're above that, we're definitely closer to the bottom of the monthly range than the top. This isn't a chart that instills confidence.
The Bollinger Bands also show a Middle band at 1.51998, with the price's position at 37.62%. This means XRP is trading below its middle band and well within the lower half of its typical range. The squeeze is normal, so no explosive move is necessarily imminent from that perspective. It just feels like a languishing asset.
So, for any XRP prediction for 2026, you've got to consider this ongoing weakness. The current XRP analysis suggests that without a significant shift in fundamentals or sentiment, climbing back to those EMA levels will be a monumental task. This isn't just a dip; it's a structural weakness that needs addressing.
Sometimes you just gotta step back and let the market decide if it wants to turn around. No need to be the hero, especially not when the data points against it so strongly. For further analysis and insights across various assets, the FCS API blog has more articles that dive into these market dynamics.
My Take on XRP Price Today
Given the overwhelming number of "Sell" and "Strong Sell" signals, particularly from the moving averages, I wouldn't touch XRP with a ten-foot pole at 1.4227 today. The slight positive change is a distraction, not a turnaround. The overall trend remains strong, but in a bearish direction for the time being.
My XRP forecast for the short to medium term leans heavily bearish, and I see more downside risk than upside potential right now. There's just too much technical resistance to overcome. Don't chase a little green candle when the big indicators are flashing red.
For those interested in pulling this kind of granular data for their own XRP analysis, check out the FCS API crypto pricing plans. Real-time data like this is essential for cutting through the noise and seeing what's really happening. It stops you making dumb moves based on feelings.

