
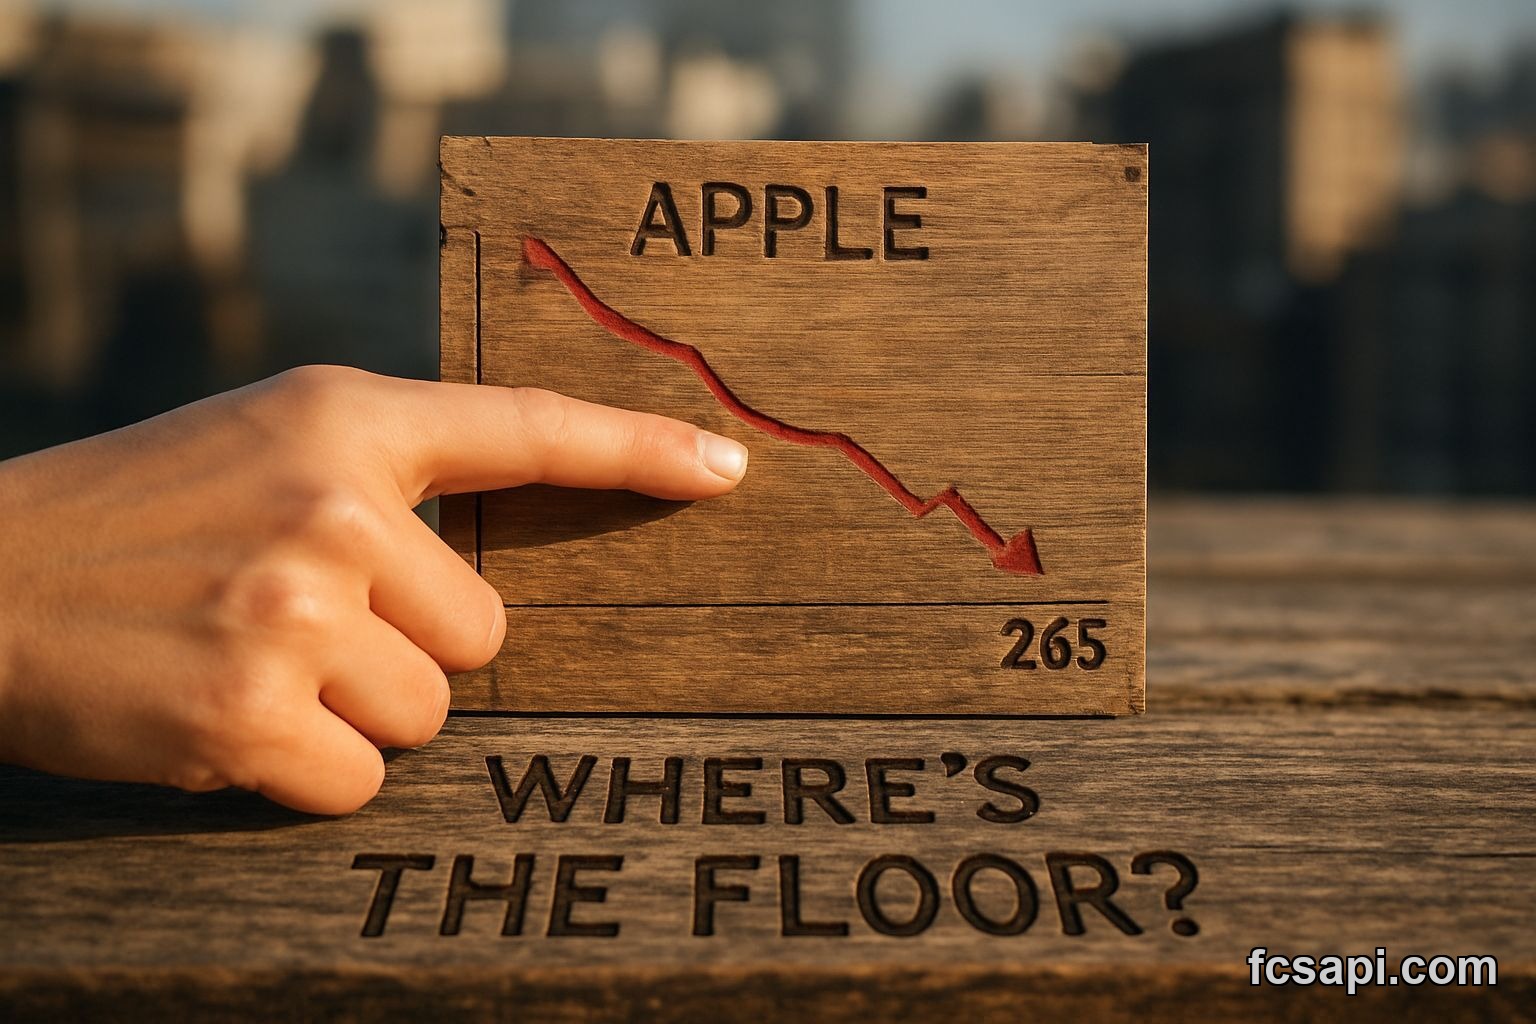
Apple closed at $260.58 today. That's $4.42 below the EMA 25, which now sits at $265. The 25-day exponential moving average just flipped to Strong Sell. When price drops through that line, it's not a hiccup — it's momentum shifting.
I've watched AAPL bounce off the EMA 25 three times this year. It held. This time it didn't. The stock opened at $262.60 and slid through the day. Down 0.77%. Small number, wrong direction.
The Sell Signals Are Stacking
MACD level sits at 0.1272 — a Sell signal. Not screaming, but there. The SMA 25 is at $262.10, also a Sell. Two different moving averages, same message. Price is below both.
The EMA 25 Strong Sell matters more than the SMA 25 Sell because exponential averages weight recent price action heavier. They react faster. When both turn bearish, the short-term trend isn't your friend.
Here's the part that bugs me: Stochastic K% is at 37.45 with a Buy signal. ATR shows a Buy too at 6.50. But those are volatility and momentum oscillators. They're not telling you direction — they're telling you the stock is oversold or moving. That's not the same as "buy this now."

Where the Floor Actually Sits
The SMA 200 is at $240.85 — a Strong Buy level. That's $19.73 below today's close. If AAPL falls to the 200-day, that's a 7.6% drop from here. Not apocalypse, but not nothing either.
Demark pivot points give us some structure. S1 support sits at $263.40. We're already below it. R1 resistance is up at $267.77. That's $7.19 away. The pivot point itself is $265.11 — right where the EMA 25 is camped out.
So the technical picture says this: Apple lost its short-term support zone. The next real floor is the 200-day moving average, which is a long way down. Between here and there? Not much.
Performance Doesn't Save You
Six-month performance is up 15.21%. Sounds good until you check the one-week number: down 5.45%. That's where the pain is. Five percent in a week wipes out a month of gains. The trend flipped fast.
All-time low for AAPL was $0.049 — irrelevant now, but it reminds you how far this thing has climbed. When a stock's up that much over decades, pullbacks feel worse because the stakes are higher. A 10% correction on AAPL in 2026 is a bigger dollar move than it was in 2010.
The overall signal from FCS API is Neutral with Low confidence. That's market-speak for "we don't know." When confidence is low, the indicators are fighting each other. Some say buy, some say sell, none are screaming loud enough to matter.
What Could Go Wrong From Here
Price action is labeled Bullish, but the trend is only Moderate. Those two things don't line up. Bullish price action with a moderate trend means the upside momentum is fading. You're still technically in an uptrend, but it's losing steam.
The risk isn't that Apple crashes tomorrow. The risk is it drifts lower while you wait for a bounce that doesn't come. You sit at $260, then $255, then $250, telling yourself it's just a pullback. Then you're at the 200-day and wondering how you got there.
I don't short big-cap tech because it's a widow-maker trade. But I also don't buy when the short-term moving averages all point down. The EMA 25 Strong Sell is the loudest voice in the room right now.
Check the pricing plans if you want live data on this. Watching the EMA 25 daily tells you when the trend shifts back. Until then, you're catching a falling knife.
The One Number That Changes Everything
The 200-day moving average at $240.85 is the line. If AAPL holds above it, this is just noise. If it breaks below, the whole structure changes. That's when "buy the dip" becomes "wait for confirmation."
Right now, we're 7.6% away from finding out. The MACD is selling, the EMAs are selling, and the only thing saying buy is an oversold oscillator. That's not a bet I'm taking.
For more on how to read these signals, check the blog. I've written about Apple Inc. forecast 2026 setups before. This one's different because the short-term structure broke. The EMA 25 was holding, now it's not. That's the


