
Alphabet Inc. (GOOG) took a dip today, falling from an open of 312.805 to close at 307.15. That's almost two percent down. Don't let the 'Weak Buy' signal trick you into thinking this stock is ready to rebound, not yet anyway.
Today, February 27, 2026, the technicals are painting a pretty murky picture for GOOG. Sure, it bounced a bit over the last week, up 1.53048%, but the bigger indicators are screaming something else entirely.
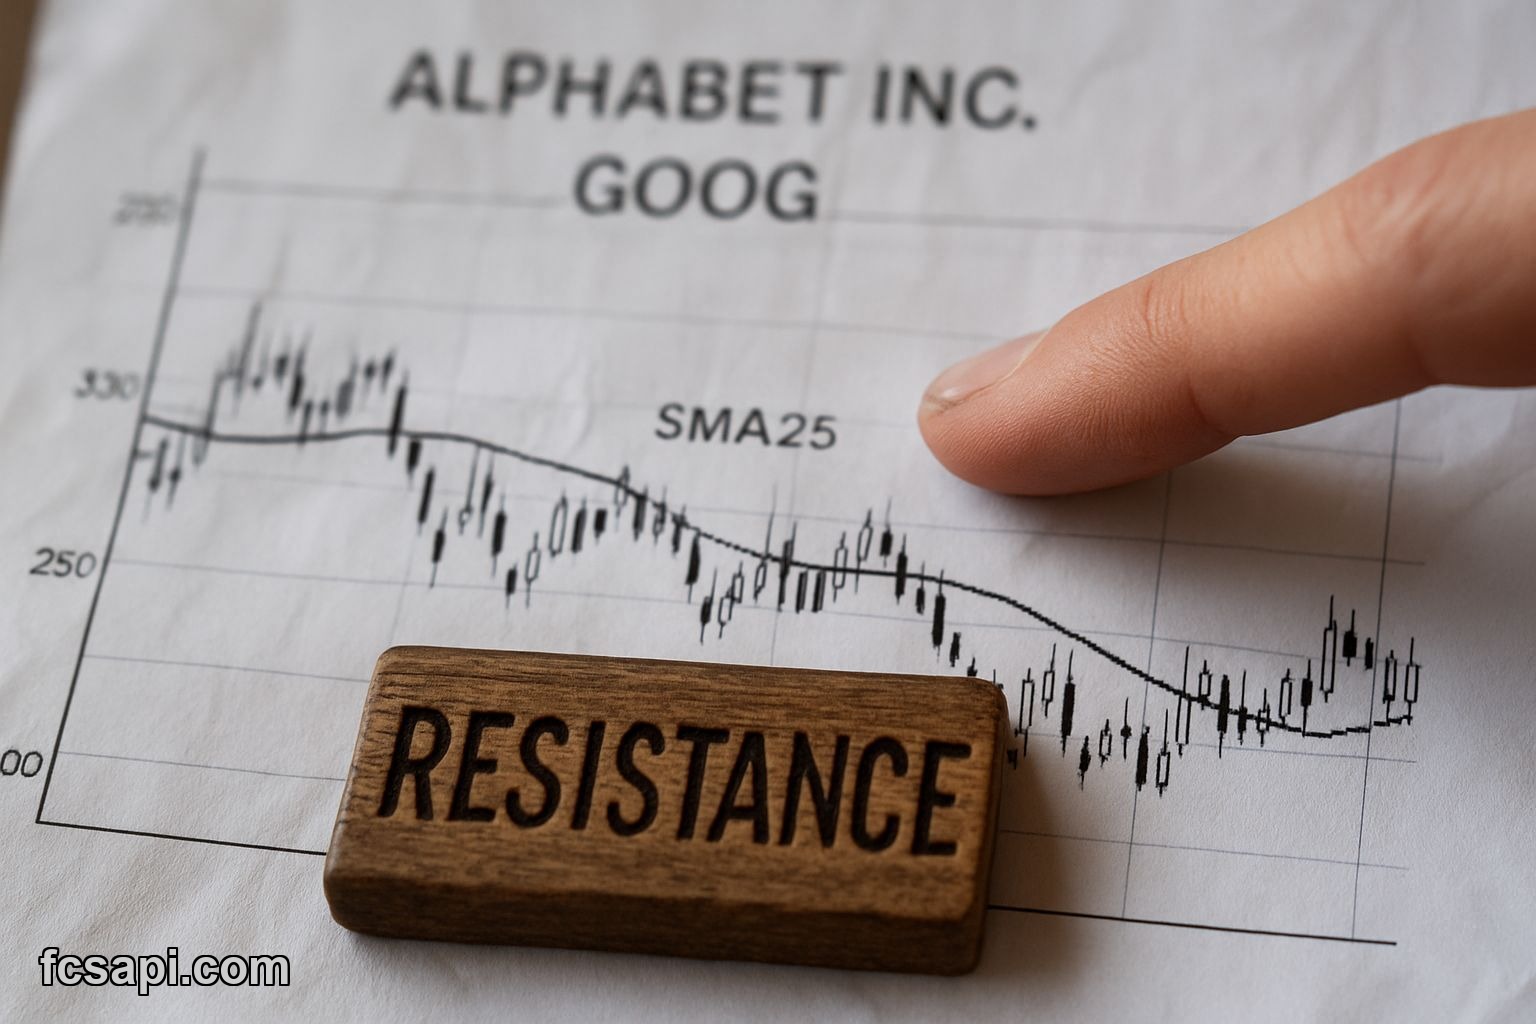
The 322 Problem for Alphabet Inc.
If you're looking at Alphabet Inc. price today, the real trouble starts around the 322.098 mark. That's the SMA 25, and right now, it’s flashing a 'Strong Sell' signal. This isn't just some random line on a chart; this is a significant resistance point, a real wall that GOOG needs to punch through.
The stock is currently trading well below that level, sitting at 307.15. This gap tells you how much work Alphabet Inc. has ahead of it if it wants to reclaim any kind of sustained bullish momentum. Until it can get decisively above that 322.098, forget about breaking out. That SMA 25 is the line in the sand, and it's holding firm.
I’ve seen stocks ping-pong off levels like this for weeks. Back in '24, I got burned on a similar setup, kept buying dips expecting a breakout, only for it to repeatedly get rejected. The 322.098 is crucial for any Alphabet Inc. forecast 2026. Without breaking it, any rally is likely just short-lived noise.
Bearish Winds Everywhere
It's not just the SMA 25 giving Alphabet Inc. headaches. The sentiment is broadly negative across other key moving averages too. The EMA 10, a much faster-reacting average, is also at 311.501 and registers a 'Strong Sell'. See a pattern here?
Then there's the Parabolic SAR, currently sitting even higher at 327.159, another 'Strong Sell'. This isn't just one indicator being bearish; it’s a chorus. When multiple heavy hitters like these all align on the downside, you need to pay attention. The market is telling you something clear: expect resistance.
This widespread 'Strong Sell' across the moving averages and SAR strongly suggests that the downward pressure on Alphabet Inc. stock is substantial. Sure, you've got a 'Weak Buy' overall signal and some bullish price action noted, but these aren't the kind of endorsements that typically stand up against such strong technical headwinds.
The Faint Glow of Hope?
Despite the bearish onslaught, there are a couple of green shoots. The ATR (Average True Range) at 8.8657 is a 'Buy' signal. Same for the Stochastic K%, which is at 35.0384, also a 'Buy'. These are momentum indicators, often showing short-term shifts.
They contribute to the overall "Weak Buy" signal the system is generating. But let's be real, with 'Strong Sell' on the SMA 25, EMA 10, and Parabolic SAR, these 'Buy' signals feel more like minor tremors than an earthquake. The confidence in that overall 'Weak Buy' signal is low, which frankly, makes a lot of sense.
These divergent signals can be tricky. You look at something like the Stochastic K% and think, "Okay, maybe there's a bounce coming for Alphabet Inc. buy or sell." Then you glance at the 322.098 SMA 25 and realize the climb is steep. These small buy signals often get steamrolled when major resistance levels loom so large.
Where Are the Pivot Points?
Let's talk about pivot points because they offer another perspective on potential support and resistance for Alphabet Inc. price today. The Camarilla pivots put resistance (R1) at 313.424 and support (S1) at 312.636, with the pivot point (P) at 313.03. Fibonacci gives us R1 at 313.659 and S1 at 310.374, with P at 312.017.
Notice something? All these pivot points are above the current price of 307.15. The lowest support from the Fibonacci pivots, S1 at 310.374, is still above where GOOG is trading right now. This means even the immediate technical structure suggests the stock is currently below its recent equilibrium points.
These pivot points, while not as long-term as SMA 25, reinforce the idea that Alphabet Inc. is facing an uphill battle. Getting above P and R1 for either Camarilla or Fibonacci would be a start, but that's still well short of the crucial 322.098 level. You can pull this kind of granular data for any stock with FCS API, it's indispensable for seeing these micro-battles unfold. Check out the stock API documentation if you're into digging through the details like this. This Alphabet Inc. analysis requires all these moving parts.
The Road to Recovery
The all-time high for Alphabet Inc. is 350.15. That feels like a lifetime ago considering the current price. It's a reminder of just how much ground needs to be recovered, especially with the 322.098 acting as such a significant lid on price action. This isn't a simple dip; it's a structural challenge.
For any significant upward move, GOOG needs to get a real bullish signal, not just a 'Weak Buy' with low confidence. It needs to clear that 322.098 resistance with conviction. Anything less just invites another rejection and likely a slide back down. We've seen it play out time and again.
My take? Don't rush into Alphabet Inc. buy or sell right now. The overall picture is too mixed, leaning bearish, and that 322.098 SMA 25 is a monster to overcome. Wait for a clear break above it, or at least some sustained buying pressure that doesn't immediately get smacked down. This Alphabet Inc. prediction leans cautious, very cautious, until that 322 level is history. Need more analysis? The blog has plenty more where this came from.


