

Fairfax Financial Holdings Limited closed at 2365 today. One month ago it hit 2471. That's a 4.3% drop most people already forgot about.
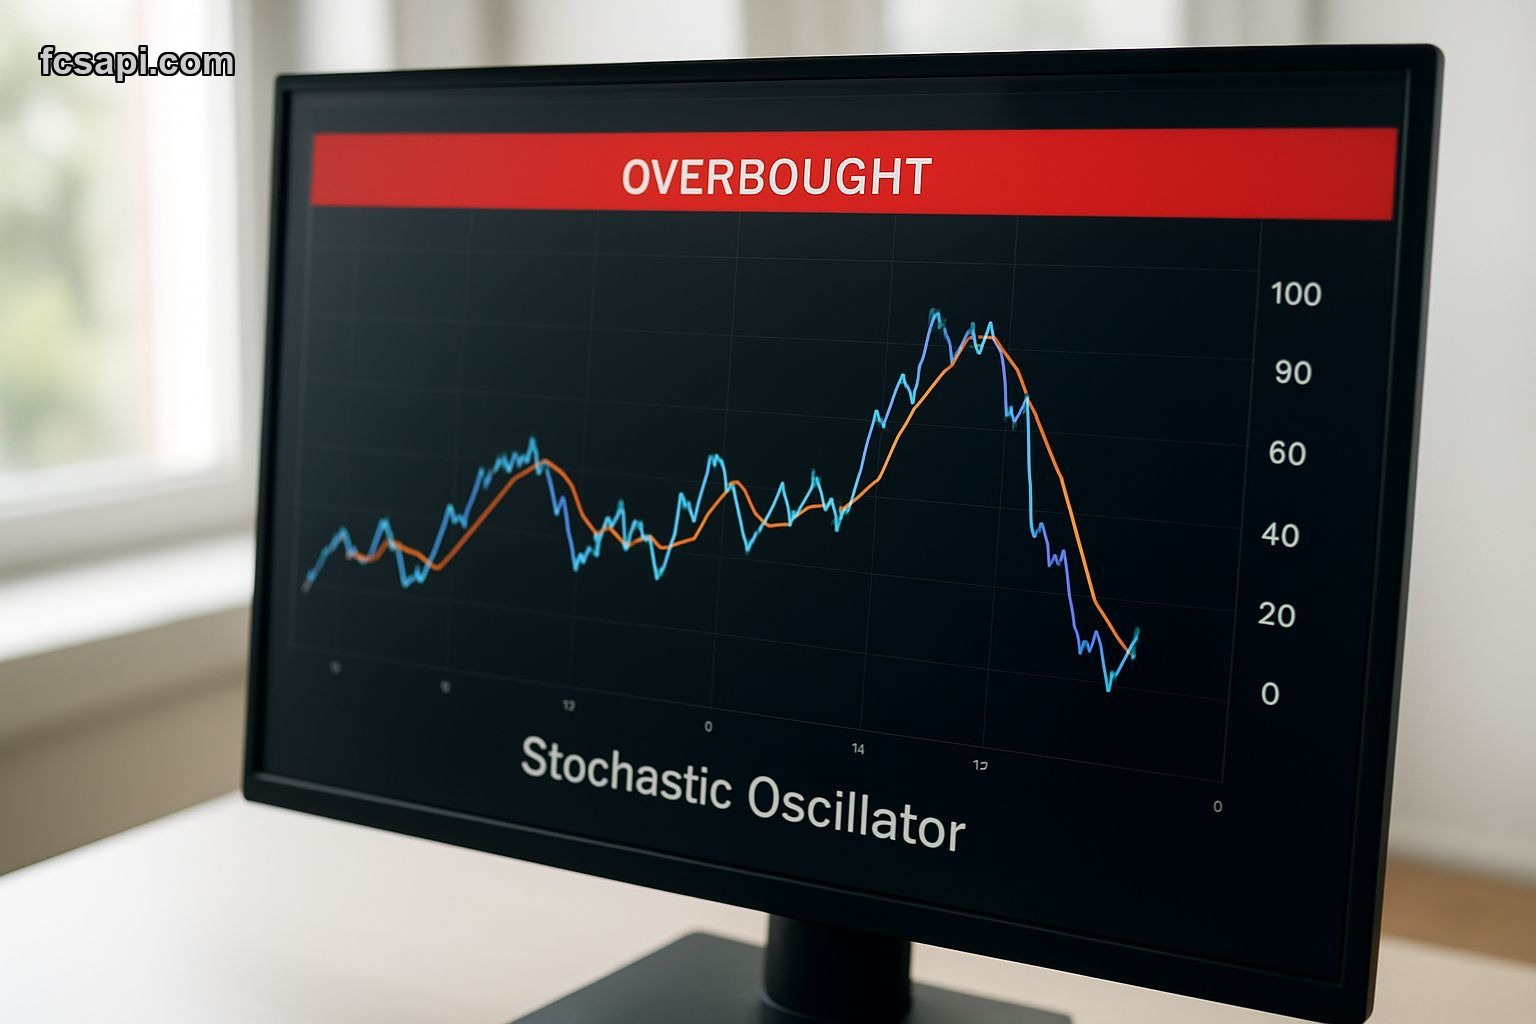
The signal calls it a weak buy with a score of 29.6. But here's the part that matters — the Stochastic K% sits at 83.87. That's deep in overbought territory. When I see a buy signal paired with an overbought oscillator, I don't rush in. I wait.
The Peak That Disappeared
FFH printed 2471 on January 18th. Nobody rang a bell. The stock just quietly rolled over and spent the next month grinding lower. Now we're sitting 106 points below that high, and the technical picture looks confused.
The moving averages all say buy. EMA 25 at 2354, SMA 10 at 2319 — both below current price. That's textbook bullish structure. But the Stochastic reading tells a different story. When that number crosses 80, I've learned to be careful. Not bearish, just careful.
I've held FFH through three different cycles. Bought some at 890 in 2020, added at 1340 in 2022, sold half at 2180 last year. Kept the rest because Prem Watsa knows insurance better than I ever will. But right now? I'm not buying more at 2365 with the Stochastic this high.
What the Numbers Actually Mean
ATR came in at 62.40 today. That's the average true range — basically how much the stock moves. For FFH, that's normal. It's a big, liquid Canadian name that swings 50-70 points regularly. Nothing scary there.
The Camarilla pivot points give us R1 at 2361 and S1 at 2352. We closed above resistance, which technically is bullish. But we're also only 19 points from that mid-point pivot at 2356. That's a narrow range. When FFH compresses like this after a pullback, it usually means something's about to give.
Here's what I'm watching: if we break below 2352, the next stop is probably 2319 where that 10-day moving average sits. That would be a 2% drop from here. Not the end of the world, but enough to hurt if you bought today.
The All-Time Low Nobody Talks About
FFH traded at 57 once. The data doesn't say when, but I know it was decades ago. That's a 41x return from the bottom to today. Watsa built this thing from almost nothing.
I mention this because perspective matters. When you're staring at a 4% pullback from 2471, it feels urgent. But zoom out and FFH has been a monster for patient holders. The problem is figuring out if 2365 is a patient entry point or a place to wait.
The weak buy signal isn't wrong. The trend is up. We're above all the moving averages that matter. But that Stochastic reading at 83.87 says momentum is stretched. In my experience, stretched momentum can stay stretched for weeks. Or it can snap in two days. You don't know which until it happens.
Canadian Insurance in 2026
FFH is a holding company, not a pure insurer. They own pieces of everything — insurance, reinsurance, random investments Watsa likes. That structure makes it hard to value. But it also gives you diversification inside one stock.
The Canadian market has been weird this year. Energy names ripped, banks chopped sideways, insurance has been mixed. FFH gained less than 1% today, which is fine. But it's also down 4.3% from the January peak, which means the bulls lost control somewhere along the way.
I pulled some historical data from the stock API documentation last week. FFH has a habit of grinding higher in Q1, peaking mid-quarter, then consolidating for weeks. That pattern played out again this year. We peaked January 18th, now we're consolidating. The question is whether we consolidate at 2365 or 2250.
Why I'm Not Buying Today
The signal says weak buy. I get it. But weak means weak. It's not a strong buy for a reason. The score of 29.6 is barely above neutral. If this were a 60+ score with a strong buy, I'd think differently.
The Stochastic at 83.87 is the real problem. When I see that number, I know the stock has run hard recently. Maybe it keeps running. Maybe it doesn't. But the risk-reward shifts. You're buying near a local top, hoping for a breakout above 2471. That's only 4.5% upside to the recent high. Meanwhile, the downside to that 10-day moving average at 2319 is 2%.
That's not a terrible ratio, but it's not great either. I've made money on FFH by buying pullbacks, not chasing overbought rallies. So I wait. If we dip to 2320, I'll think about adding. If we break above 2471, I'll admit I was wrong and the momentum carried through.
For now, I'm watching. The trend is up, the structure is bullish, but the momentum is tired. You can check API pricing plans if you want to track FFH in real-time. I usually pull data twice a week, more if something big happens.
The Trade I'm Actually Making
I'm holding what I have. Not adding, not selling. If you don't own FFH yet, waiting for a better entry makes sense. If you already own it, today's price action doesn't change the thesis. Watsa still runs the show, the insurance book is solid, the investments are diversified.
The weak buy signal isn't screaming urgency. The Stochastic overbought reading is screaming caution. When those two clash, I side with caution. That's worked for me more often than not. Maybe I miss a 5% rip higher. But I also avoid buying the local top, which I've done too many times before.
You can read more about signal interpretation on the stock market articles and analysis page. FCS API tracks this stuff better than I do manually. I just try to make sense of it.
I'm holding my FFH position and waiting for a clearer setup. If that means missing a rally, fine — I'd rather wait for 2320 than chase 2365.


