
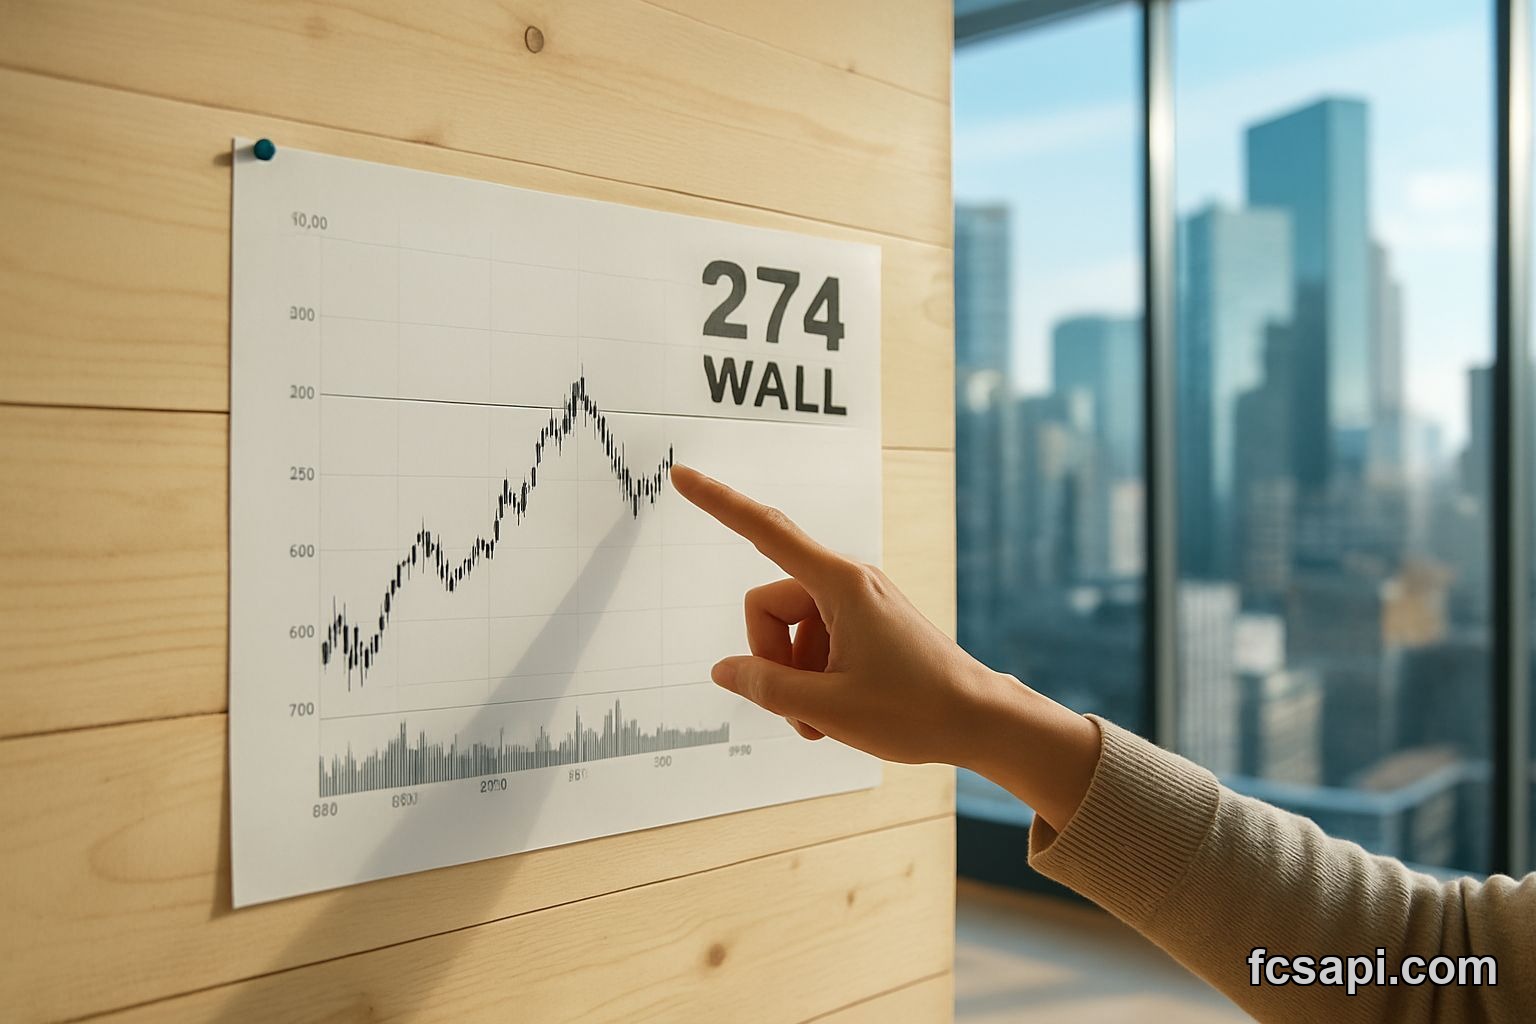
Apple closed at $272.95 today after opening higher at $274.94. That's a -0.73% drop, and it's the second time this week the stock couldn't hold above $274. Everyone sees the strong buy signals. I'm looking at where it keeps failing.
The technical setup looks clean on paper. MACD sits at 1.62 in buy territory. Parabolic SAR at $255.84 gives a clear upside bias. Every moving average — 25-day SMA at $265.38, 25-day EMA at $266.79, 100-day EMA at $261.34 — all point up. But price action keeps hitting a wall.
The Fibonacci Resistance Nobody's Trading Through
R1 Fibonacci resistance sits at $274.89. Apple touched $274.94 at open, got rejected, and spent the rest of the day sliding. That's not random. When a stock opens right at a key level and immediately reverses, that level matters.
S1 support is down at $271.92. We're trading 71.62% up the Bollinger Band range, which means there's more room to fall than to run if sentiment shifts. The band middle is way down at $265.38. I've seen stocks snap back to that middle band faster than anyone expects when they get this extended.
Here's what the levels tell you:
- Pivot point: $273.41
- Resistance 1: $274.89 (tested twice, held twice)
- Support 1: $271.92 (not tested yet today)
Price is squeezed between pivot and R1. That's a narrow band. Something breaks soon.
Volatility Is Higher Than You Think
ATR percentage sits at 2.32%. That's high volatility for Apple. The stock hit $280.91 just one month ago, and now it's struggling to stay above $273. Weekly performance shows +3.94%, which sounds good until you realize it gave back most of that gain in two days.
Bollinger Bands show normal squeeze conditions, but position at 71.62% suggests the next big move is probably down, not up. When you're that high in the range and can't break resistance, the path of least resistance is lower. I don't make the rules.
The confidence rating on this signal is medium. That's honest. Strong buy with medium confidence means the indicators are clear but the price action isn't confirming. You want to see price breaking through R1 with volume before trusting this setup fully.
What the Moving Averages Actually Mean Here
All three moving averages are below current price, which is bullish structure. The 25-day SMA trails by about $7.50. The 100-day EMA sits even further back at $261.34. That's a cushion, sure, but it also means there's a lot of air underneath if this thing rolls over.
The gap between the 25-day and 100-day moving averages is only about $5. That's tight. When short-term and long-term averages converge like this, you either get a strong breakout or a sharp reversal. Sideways doesn't last.
| Indicator | Value | Signal |
|---|---|---|
| MACD | 1.62 | Strong Buy |
| Parabolic SAR | $255.84 | Strong Buy |
| SMA 25 | $265.38 | Strong Buy |
| Current Price | $272.95 | Below Open |
The data from FCS API shows everything lining up for more upside except the one thing that matters most — actual buying at these levels. Indicators tell you what could happen. Price tells you what is happening.
March Setup Depends on $274
If Apple breaks and holds above $274.89, the next target is probably that monthly high at $280.91. That's about 3% upside from here. MACD and SAR would support that move, and you'd have confirmation from price finally doing what the indicators suggest.
If it breaks below the pivot at $273.41 and takes out support at $271.92, then you're looking at a retest of those moving averages. The 25-day EMA at $266.79 is the first real support level where buyers might show up. That's a potential 2% drop.
Risk/reward setup favors waiting. You get better entry on a breakout above $275 with confirmation, or you get a cheaper entry near $267 if it pulls back. Trading it right here in no-man's-land between pivot and R1 is just donating to market makers.
The Signal vs Reality Gap
Strong buy signal with moderate trend and medium confidence. That's not a ringing endorsement. The bullish price action label conflicts with today's -0.73% red candle that couldn't hold the open. One of these is lying.
I've been watching Apple long enough to know it doesn't just push through resistance on the first try when volume isn't there. This needs either a catalyst or a few days of consolidation before the next leg. More market analysis helps but doesn't change what the chart shows.
The Parabolic SAR at $255.84 is your trailing stop if you're long. That's about 6% below current price, which is a reasonable risk parameter but also a big gap. High volatility means those stops can get hit on normal noise.
What I'm Watching Next Week
Volume on the breakdown from open today. If it was heavy, that's sellers showing up at resistance. If it was light, maybe it's just profit-taking and the bid comes back.
Whether we get another test of $274.89. Third time might be the charm, or it might be the one that fails hard. Resistance gets weaker with each test until it doesn't.
The 25-day moving averages are rising fast. In three trading days, the SMA will be closer to $267. If price drifts down to meet it, that's actually a healthier setup than grinding against overhead resistance with extended band positioning.
Check real-time stock data access if you're tracking this closer than daily closes. Intraday moves at these levels


