

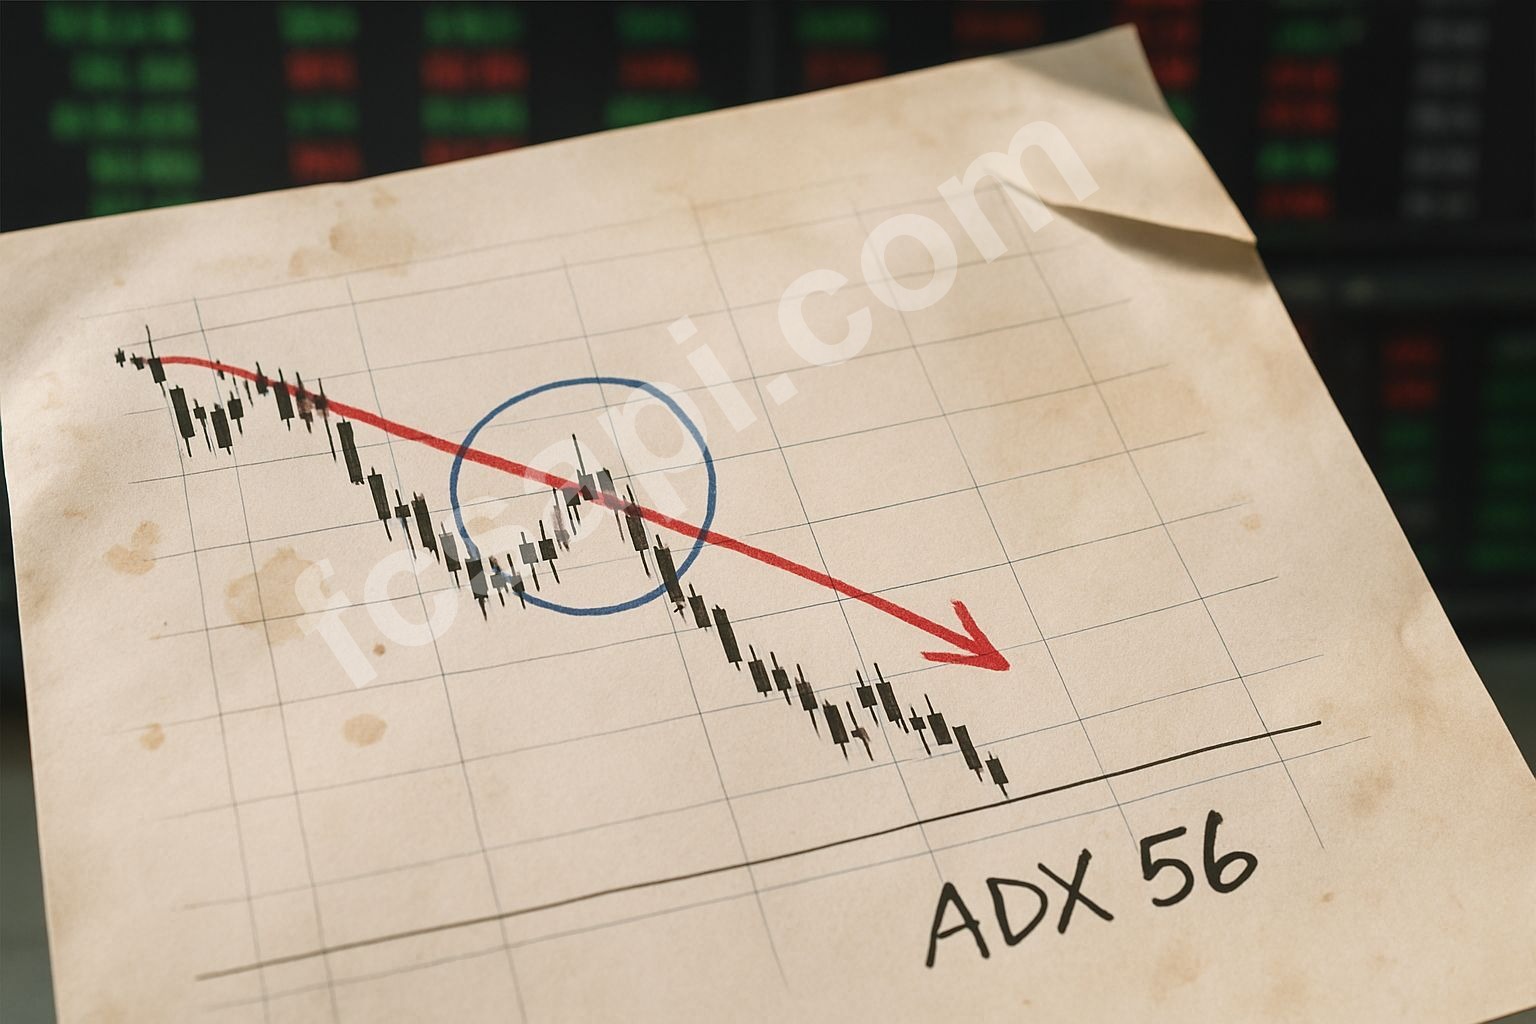
The ADX reads 56. That's not noise. That's a screaming trend with conviction, and right now it's pointing one direction while price stumbles the other way.
Bitcoin closed at $68,241 on February 16, 2026. Down eight-tenths of a percent from the open. The signal from FCS API? Sell, with high confidence and a score of -53.6. I've watched plenty of mixed signals in my time, but this one's got clarity.
The ADX Problem Nobody Wants to Talk About
ADX measures trend strength. Above 25 means there's a trend. Above 50 means it's strong. At 56, Bitcoin's got momentum — just not the kind bulls want to see right now.
The price action says bullish. RSI at 35 screams oversold, technically a buy. Ultimate Oscillator sits neutral at 43. But here's what I learned the hard way in 2024: when ADX is this high and moving averages are all flashing sell, the trend wins. Always.
Look at the moving averages. Every single one points down:
- EMA 200: $93,856 — Bitcoin's trading 27% below that
- SMA 25: $76,158 — still 10% above current price
- EMA 10: $69,578 — barely overhead at 2%
That's not consolidation. That's distribution. The short-term average is closest to price, which tells me the recent move down has been sharp and consistent.
Six Months of Pain
The six-month performance sits at -39.5%. That's not a dip. That's a wipeout. I remember buying into "corrections" in late 2023 that looked just like this. Thought I was getting a discount. Wasn't.
The one-week chart shows -2.8%, which means the selling pressure isn't easing up. It's steady. Methodical. The kind of decline that grinds you down rather than shaking you out violently.
Volatility's high at 5.4% ATR. That means daily swings are big enough to fake you out if you're trying to catch a bottom. I've been faked out plenty. Still hurts to think about.
Fibonacci Levels and False Hope
The Fibonacci pivot shows resistance at $70,366 and support at $68,154. Current price is sitting right between them, closer to support. That's not comforting when you look at where the longer-term averages are.
If Bitcoin breaks support here, the next meaningful level is.. well, there isn't one nearby. The SMA 25 is way up at $76k, which now acts as resistance, not support. That's a role reversal that happened while everyone was busy watching Elon tweet.
I pulled data through FCS API this morning, same way I do every day. Real-time feeds matter when you're watching a trend this strong. Stale data gets you killed in moves like this.
What the RSI Lie Costs You
RSI at 35 says "oversold, time to buy." I've fallen for that trap before. RSI can stay oversold for weeks in a strong downtrend. The ADX tells you if that downtrend has legs. At 56, it does.
This is where people get cute with bottom-fishing. They see RSI low, they see price action labeled "bullish," and they convince themselves the chart's wrong. The chart's never wrong. Your interpretation is.
The Ultimate Oscillator at 43 is trying to be diplomatic, sitting in neutral territory. But when RSI says buy and moving averages scream sell, neutral isn't helpful. You need a tiebreaker. That's the ADX. And it picked a side.
My Take on This Mess
I'm not buying here. The signal confidence is high, the trend strength is undeniable, and every meaningful moving average is overhead acting as resistance. That's three strikes.
Could Bitcoin bounce from $68k? Sure. Will it hold? I doubt it. The six-month performance chart looks like a ski slope, and nothing in today's indicators suggests that's changing.
If you're long from higher levels, this is where stops get tested. If you're looking to enter, wait for the ADX to cool off below 40 and for at least one moving average to flip bullish. Catching falling knives is how you end up with scars.
The Bitcoin price today is $68,241. The forecast for 2026 looks rough if this trend holds. I've been wrong before — plenty of times — but I'm not fighting an ADX this high. Check the full crypto analysis here if you want more context. For now, I'm sitting this one out.

