
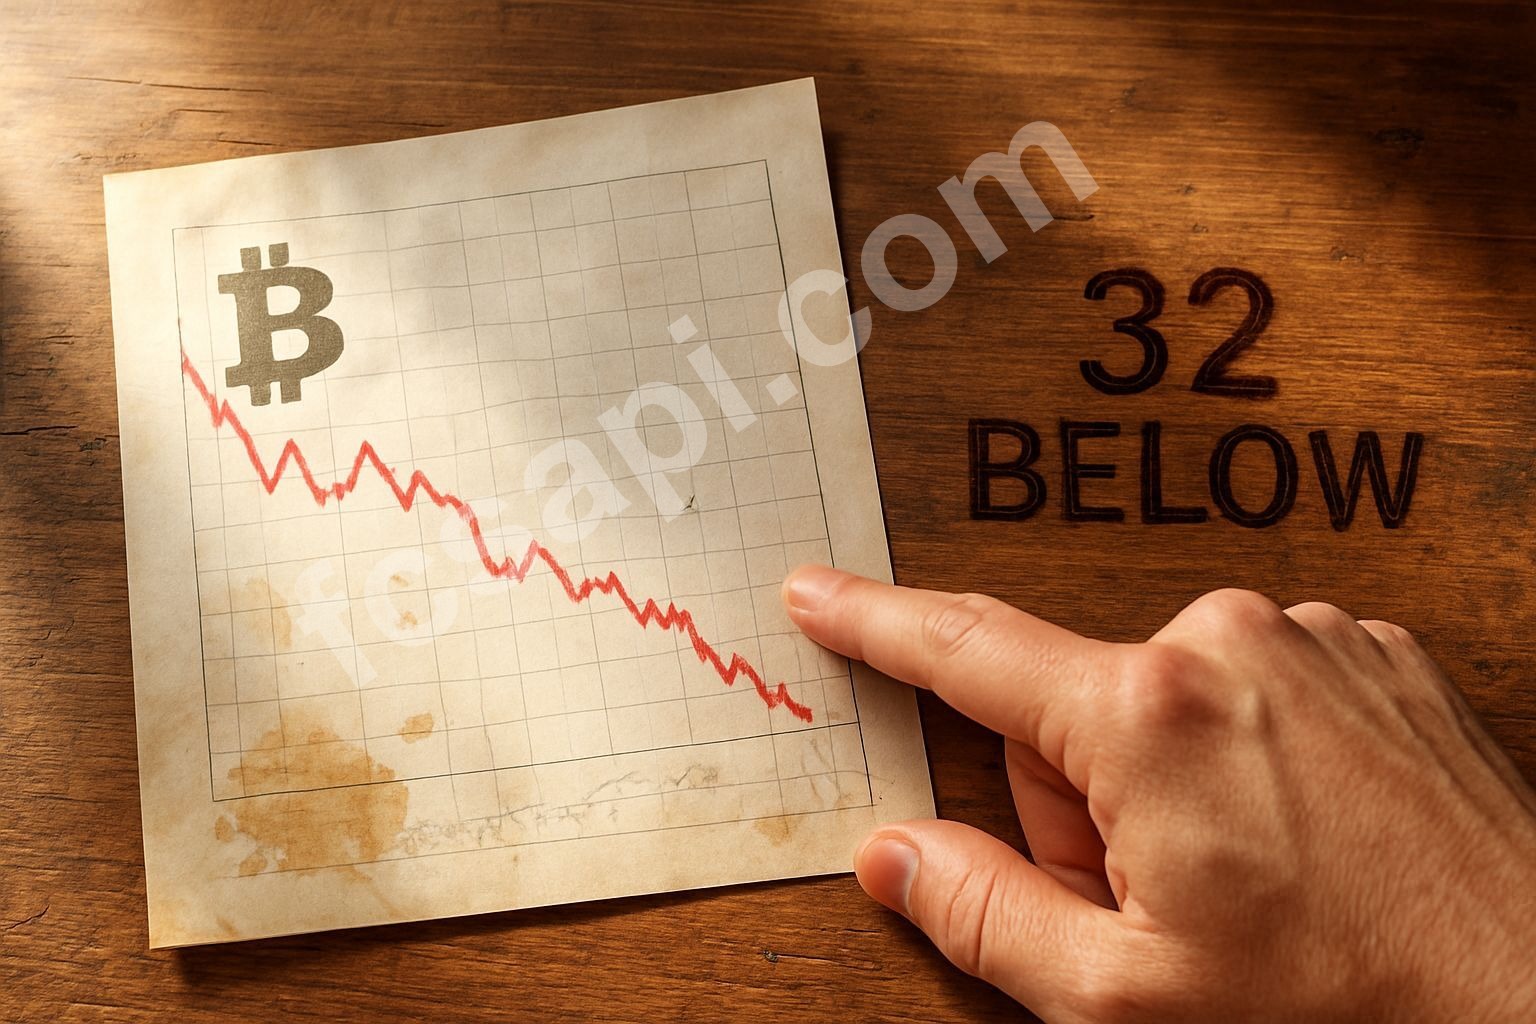
The 200-day simple moving average sits at $100,330. Bitcoin closed today at $68,283. That's a 32% gap, and it's the most telling number on the chart right now.
I've watched coins recover from worse. I've also watched them stay underwater for months. The difference usually comes down to whether the moving averages stack up or spread out like this.
The Moving Average Problem
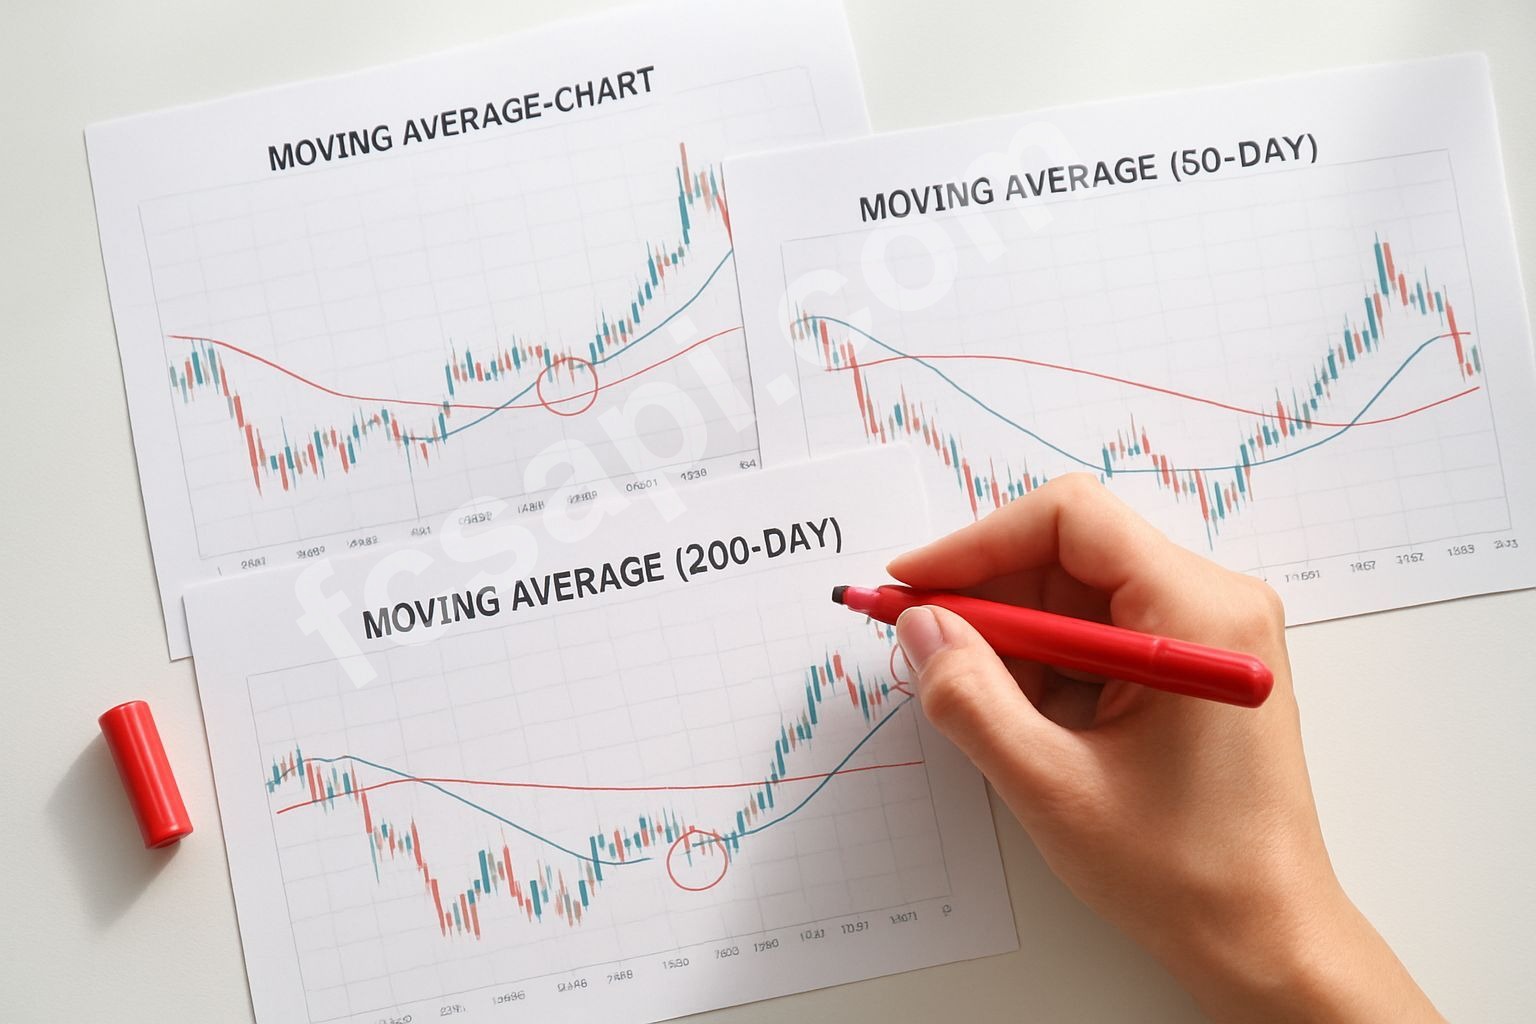
Every major timeframe is pointing down. The 200-day SMA says strong sell. The 100-day EMA at $87,432 says strong sell. Even the 10-day SMA at $68,736 crossed over and flipped to sell.
That's not a mixed signal situation. That's alignment in one direction, and it's not the direction you want if you're holding spot.
The six-month performance sits at -39.51%. That's not a correction anymore. You don't lose 40% in half a year and call it a dip. The one-month low touched $59,977, which means we've bounced about 13% off that bottom — but bounces don't change trend direction on their own.
What The Oscillators Actually Show
RSI at 35.48 technically flashes buy. So does the ADX at 56.26, which also confirms the trend is strong. But here's the thing — a strong trend going down is still going down.
The Ultimate Oscillator stays neutral at 43.36. That's the only indicator not screaming in either direction, which tells me momentum hasn't completely died yet. But momentum doesn't matter if the structure underneath is broken.
I've been burned before chasing oversold readings. RSI can stay oversold for weeks in a real downtrend. It's a timing tool, not a reversal signal.
Volatility Numbers Tell A Different Story
ATR percentage sits at 5.42%. That's high volatility territory. Big swings in both directions, which means anything can happen on a daily basis — but the bias still leans bearish when you zoom out.
The Fibonacci pivot sits at $69,260 with resistance at $70,366 and support at $68,154. We're trading below the pivot right now. That's not a great place to be if you're looking for upside continuation.
Woodie pivots show similar structure. R1 at $70,238, support at $67,342. The price action from Friday's open at $68,792 to today's close lost 0.74%. Small move, but direction matters more than size right now.
The Conflict Between Short and Long Term
Here's what keeps me up at night with this setup. Short-term indicators say oversold, maybe a bounce coming. Long-term structure says the bigger trend is still intact and pointing down. When those two things disagree, I trust the longer timeframe.
The trend reads as "strong" in the data. Price action is labeled "bullish". But the moving averages all say sell. That's cognitive dissonance in chart form.
I think what's happening is the recent bounce off $59,977 created some short-term bullish momentum while the overall structure stayed bearish. You can get局部 strength inside a bigger downtrend. Happens all the time. Doesn't mean the downtrend is over.
What I'm Watching Next Week
If the price can reclaim the 10-day SMA at $68,736 and hold above it for a few sessions, that would be the first hint of a shift. But it needs to happen with volume and follow-through, not just a quick spike that fades.
The real test comes if we push toward the 100-day EMA at $87,432. That's a long way up from here — about 28%. I'm not holding my breath for that move in the next month.
More likely scenario: we chop around between the Woodie support at $67,342 and Fibonacci resistance at $70,366 while the moving averages slowly catch up. Boring, but that's how downtrends usually resolve — not with a dramatic V-bottom, but with a long sideways grind that eventually leads somewhere.
The crypto API documentation from FCS API shows live feed structure for tracking these levels in real time. I check it more often than I probably should.
My Take On The Sell Signal
I'm not fighting this one. The signal says sell, the moving averages say sell, the six-month performance chart says sell. When everything lines up like that, you listen.
Could we bounce from here? Sure. Oversold conditions bounce all the time. But I'm not betting my capital on a counter-trend trade when the primary trend is this clear. I'd rather miss the first 10% of a reversal and catch the next 40% with confirmation than get chopped up trying to pick the bottom.
The one-week performance at -2.83% shows the selling pressure hasn't let up much. That's steady erosion, not panic selling — which can actually be worse because it doesn't create the kind of washout that marks real bottoms.
If you're looking at API pricing plans to build something around this data, volatility like this makes for good testing environments. Just don't confuse a good testing setup with a good trading setup.
The 200-Day Reality Check
That $100,330 level on the 200-day SMA keeps staring at me. It's 47% above current price. Even if everything went right tomorrow, that's months of grinding higher just to get back to average.
I've held through worse drawdowns and come out fine. I've also cut losses at smaller drawdowns and been glad I did. The difference wasn't luck — it was whether the underlying trend had actually shifted or if I was just hoping it would.
Right now the data points to more downside risk than upside potential. The candle pattern reads "normal" which means no dramatic reversal signal hiding in there. Just regular price action in a downtrend.
Maybe I'm wrong and we bounce hard next week. Maybe the RSI at 35 was the bottom signal and six months from now I'll wish I bought here. But I'm playing probabilities, not possibilities, and the probabilities favor the moving averages over the oscillators when they conflict like this.
Check the latest analysis if you want more perspectives, but this setup looks pretty clear to me. The 200-day SMA doesn't lie. It's just math. And right now

