

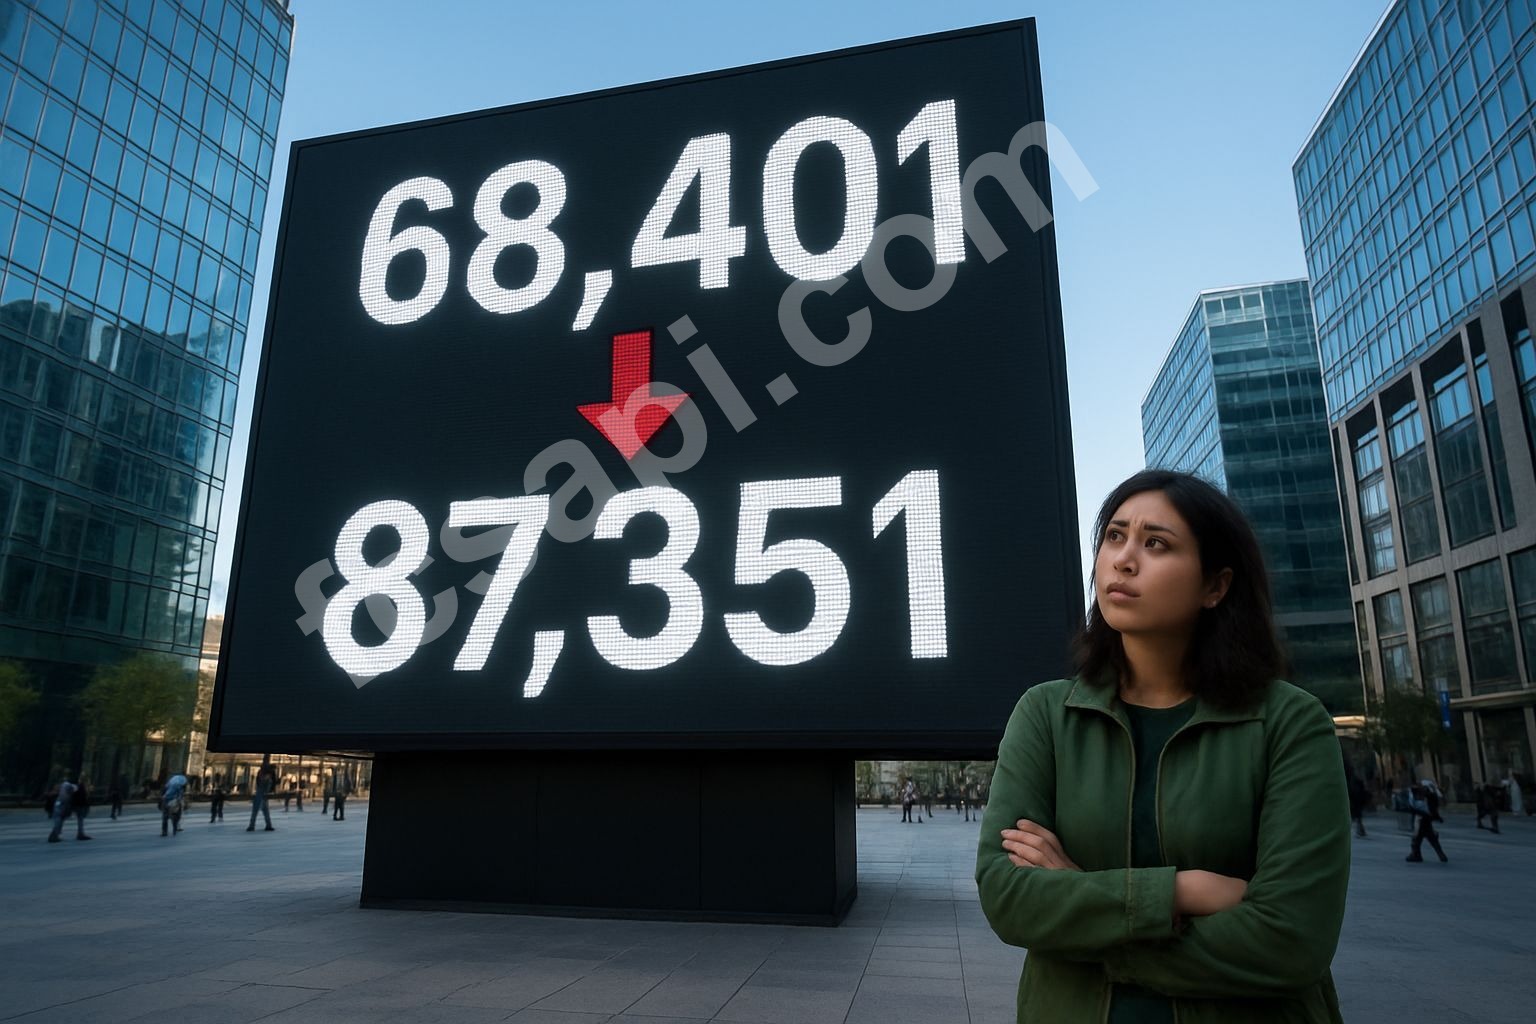
The price sits at $68,401. The signal says sell. That's not a typo.
Bitcoin dropped half a percent today, opening at $68,792 and drifting lower through the session. Not a crash. Just steady pressure downward. The kind of move that doesn't make headlines but should make you check your positions.
The Signal Contradiction
Here's the weird part. Price action looks bullish. The trend strength reads strong. But the overall signal flashes sell. That's rare.
I've seen this before. Price holds up, looks resilient, everyone thinks the bottom is in. Then you check the moving averages and realize you're standing on a trapdoor.
The SMA 10 sits at $68,748. We're already below it. SMA 100? That's way up at $87,351. We're trading nearly $19,000 below the 100-day average. That's not a dip. That's a different zip code.
What the Oscillators Say
ADX comes in at 56.26, screaming strong buy. RSI at 35.64 also leans buy. Stochastic K% at 46.78, same story. On paper, these look oversold.
But oscillators measure momentum and relative position. They don't care about context. They don't know Bitcoin hit $126,230 last year and has bled 39.5% over six months.
I trust moving averages more than oscillators when they disagree this hard. Averages show you the structural damage. Oscillators just show you today's mood.
The Six-Month Bleed
Down 39.5% in half a year. That's the number nobody wants to talk about. Weekly performance sits at negative 2.83%. Nothing catastrophic, but nothing reversed either.
All-time high was $126,230. We're at $68,401. You do the math. That's a 45.8% drawdown from peak. Not a correction anymore.
FCS API pulls this data clean, no guessing. When I see a six-month performance that ugly, I don't care what the RSI says. The trend is your enemy until it isn't.
Pivot Points
Woodie pivot shows resistance at $70,238 and support at $67,342. We're between them right now, which means we're in no-man's-land. Fibonacci pivot puts resistance at $70,366, support at $68,154.
Both methods agree: if we break $67,300, next stop is probably lower. If we push past $70,200, maybe the bleeding stops for a bit.
Why I'm Not Buying Yet
The sell signal isn't magic. It's math. When your price sits this far below major moving averages, you're in a confirmed downtrend. Doesn't matter if RSI looks oversold.
I've bought "oversold" indicators before. Lost money most of those times. Turns out things can stay oversold way longer than you can stay solvent betting against the trend.
Could Bitcoin bounce from here? Sure. Could hit that Woodie resistance at $70,238 and get people excited again. But I need to see it actually close above the SMA 10 for a few days before I believe anything changed.
The Real Test
Support at $67,342 is right there. Less than a thousand bucks away. If that breaks, I expect fast movement down. No slow bleed, just liquidations and panic.
The gap between current price and the SMA 100 bothers me most. That's not a gap you close in a week. That's months of grinding higher, assuming nothing else breaks in the meantime.
Bitcoin price today reflects six months of distribution. The data from FCS API shows every step of that decline. No gaps, no excuses.
What I'm Watching
Two levels matter. $67,342 support and $70,238 resistance. Break below the first, I'm out completely. Break above the second with volume, maybe the sell signal flips.
The ADX strength at 56.26 means whatever direction we pick, we'll move hard. Strong trends cut both ways. Right now it's cutting down despite the bullish label on price action.
Weekly performance has been negative for a while now. That's not a blip. That's a pattern. Until that pattern breaks, I'm treating every bounce as a selling opportunity, not a reason to add exposure.
Check pricing for live data if you want to track this yourself. The numbers don't lie, even when you want them to.
The forecast for 2026 hinges on whether Bitcoin can reclaim those moving averages. Right now, it can't. Until it does, the sell signal stays relevant. I've ignored signals like this before. Cost me.

