

The sell signal came through at 68238. High confidence. That's not something you ignore, even when the candle pattern looks normal and price action still reads bullish.
I've traded through enough whipsaw moves to know when the data's telling you one thing and your gut's telling you another. Right now, Bitcoin's sitting 46% below its all-time high of 126230, which sounds like a discount until you look at where the moving averages are positioned. The 25-period EMA is way up at 74857 — that's a strong sell signal. The 10-period simple moving average sits at 68731, also flashing sell.
The Gap Between Price and Momentum
Price opened at 68792 and dropped to 68238 by close. Not a catastrophic move, less than one percent down. But the momentum indicators aren't lining up with the bullish price action label. MACD level's at -4930, which technically registers as a buy, but it's still deeply negative. Ultimate Oscillator came in neutral at 43.21. Parabolic SAR's the outlier here, showing 61803 as a strong buy level.
When you've got three different oscillators pointing three different directions, that's not conviction. That's confusion. Markets don't reward confusion.
The Bollinger Band position tells you Bitcoin's trading at 34% of the band width, with the middle band all the way up at 76158. That's a lot of empty space above current price. Squeeze reading came back normal, so we're not seeing compression that typically precedes a breakout. We're just sitting in the lower third of the range.
What the Pivot Points Say About Downside
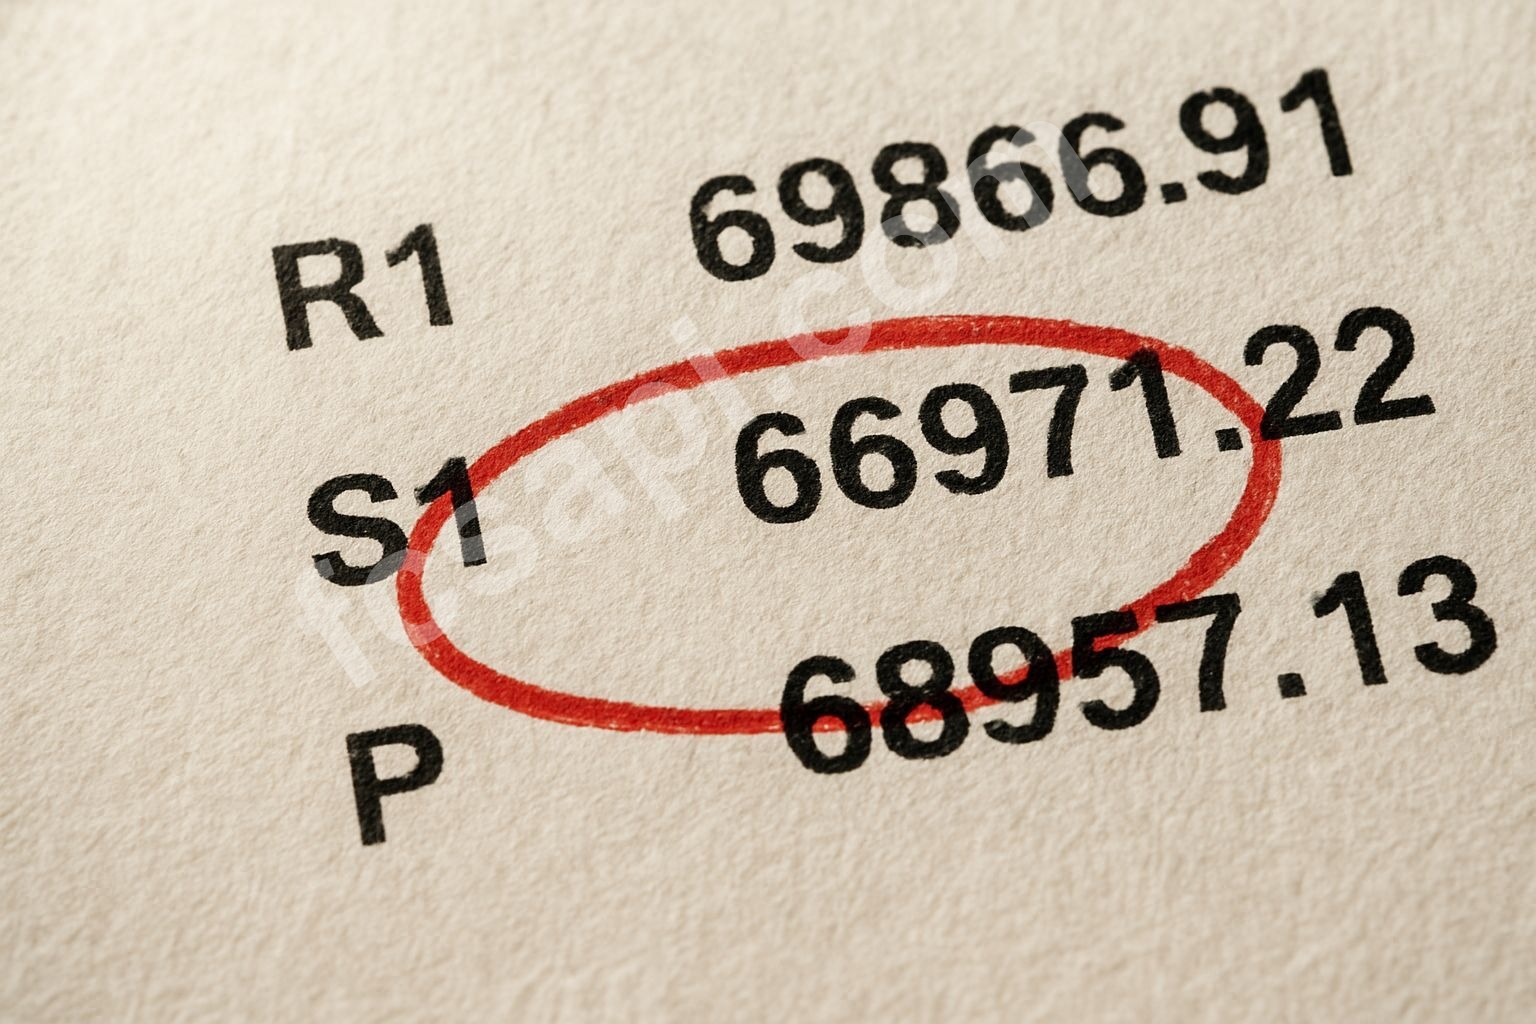
Demark pivot analysis puts resistance at 69866 and support down at 66971. The pivot itself is 68957, which means we closed below the theoretical equilibrium point for the session. That's bearish positioning. If we break that 66971 support, the one-month low of 59977 starts looking relevant again.
I'm not saying we're headed there tomorrow. But the risk is real. You've got a sell signal with high confidence, moving averages above price, and a close below the daily pivot. The setup doesn't favor buyers here.
Why Confidence Levels Matter More Than You Think
The confidence rating on this sell signal is high. That matters because low-confidence signals get reversed all the time. High-confidence ones? They tend to play out. I've ignored high-confidence signals before, convinced I knew better. Lost money every time.
FCS API pulls real-time market data that factors in more than just price. When multiple technical layers align, the confidence score reflects that convergence. This isn't one indicator acting up. It's several indicators suggesting caution at the same time.
The bullish price action tag creates cognitive dissonance here. Price action looks fine if you're just watching candlesticks. But layer in the moving averages, the sell signal, the below-pivot close, and suddenly "bullish" feels like a lagging description of what used to be true.
The Risk Nobody Wants to Price In
Here's what keeps me up: we're in a spot where casual buyers see a 46% drop from the all-time high and think "opportunity." Meanwhile, the technical structure is deteriorating. That's how you get trapped. You buy the dip, it dips more, and now you're sitting in a position that's bleeding while you wait for a turnaround that might take months.
- EMA 25 resistance: 74857
- Current price: 68238
- Gap to cover: 6619 points
- Next support: 66971
- Downside to one-month low: 8261 points
Those numbers matter because they define your risk-reward. You're looking at 8200 points of downside risk before you hit recent lows, versus 6600 points of upside just to reach a moving average that's acting as resistance. That's not a trade I want to take.
The Parabolic SAR strong buy at 61803 is the only bullish voice in this whole dataset. But that's a trailing stop indicator. It's designed to catch trends that are already established, not predict reversals. Relying on that one signal while ignoring everything else is how people get wrecked.
What I'm Watching Next
If Bitcoin holds 66971, maybe the sell signal was early and we get a bounce. That's possible. Markets don't move in straight lines. But if we slice through that support, the next meaningful floor is down at the one-month low. That's a long way to fall.
I'm not holding long positions here. The real-time crypto data is telling me to sit tight or look for short setups on any bounce toward that 69866 resistance. You can check live pricing feeds if you're building your own monitoring system. More technical breakdowns over on the main blog if you want to dig into other assets.
The sell signal's in. Confidence is high. Moving averages are overhead. We closed below the pivot. You can ignore all that if you want, but that's a bet, not a plan. What happens if you're wrong and that support breaks this week?

