

$6700. That's where Ciena Corporation closed today. Also happens to be the all-time high. Also happens to be the 1-month high. When those three numbers line up, you're either at the beginning of something big or the end of something stupid.
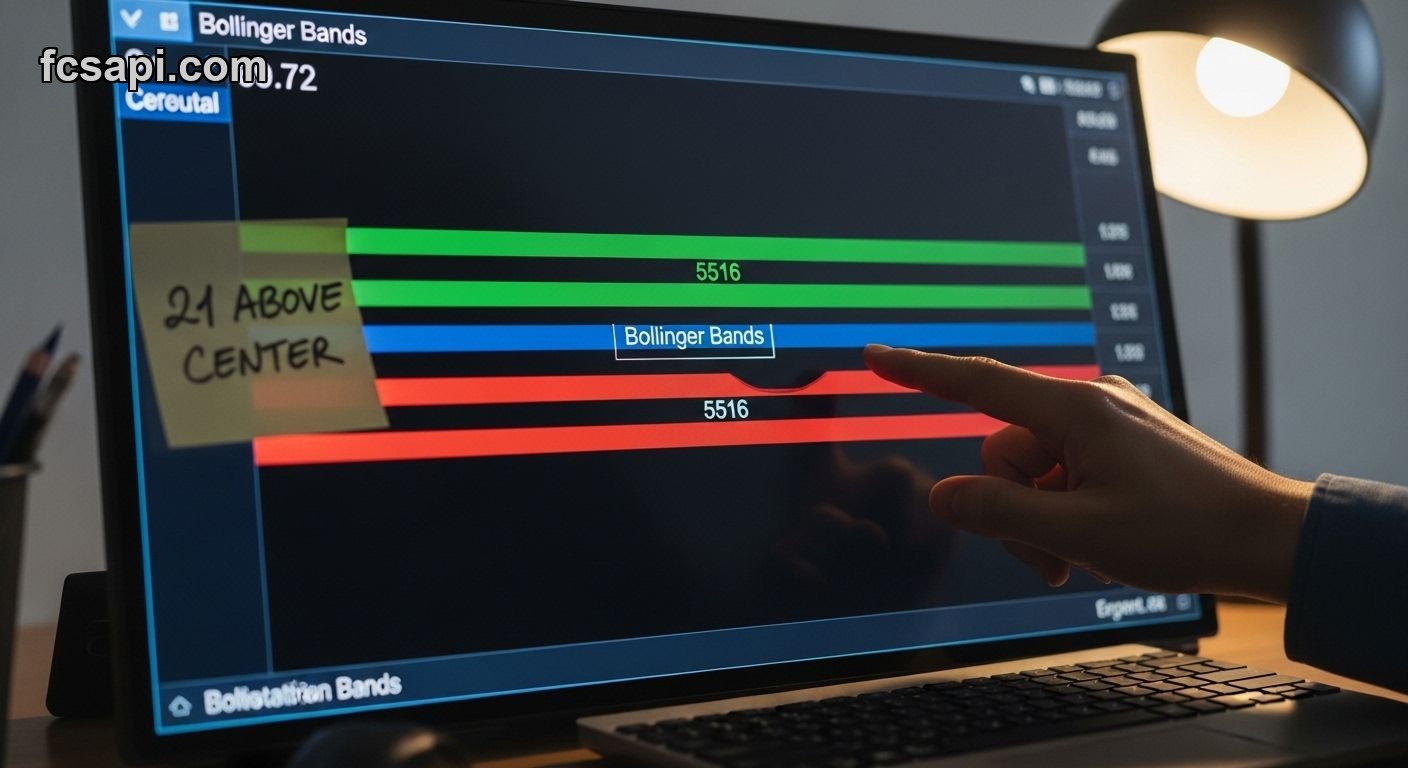
The stock opened at $6381, ran nearly 5%, and didn't look back. Strong Buy signal with an 84.2 score. Bollinger position at 69.72% — not screaming overbought yet, but close. The middle band sits at $5516, which means we're trading 21% above center. That's stretched.
Mexico Market Context
This is trading on the Mexico exchange. Not NYSE, not NASDAQ. That matters because liquidity patterns are different, volatility spikes harder, and gaps happen more often. A 5% move in Mexico doesn't carry the same weight as a 5% move in New York.
I've seen stocks run 8% in a session on MX only to give it all back by lunch the next day. Volume thins out, algos pull back, and suddenly support levels that looked solid vanish. The all-time high today could be tomorrow's resistance if nobody shows up to buy.
The trend is labeled "Strong" and price action is "Bullish" — both accurate. But momentum doesn't care about labels. It cares about where the next buyer is willing to pay.
Bollinger Band Setup
Middle band at $5516. Current price at $6700. That's a $1184 gap. Bollinger Bands aren't magic, but they tell you when price is stretched relative to recent volatility. At 69.72%, we're in the upper third but not touching the top band yet.
Squeeze reading is "Normal" — no compression, no expansion. That means volatility is steady. If we were seeing a squeeze, I'd expect a breakout or breakdown soon. Normal squeeze means the current trend can keep grinding without a catalyst.
The 1-month low was $4945. We've rallied 35% in a month. That's not sustainable unless something fundamental changed — earnings beat, new contract, sector rotation. The data doesn't tell me why this is happening, just that it is.
The All-Time High Problem
All-time highs are psychological, not technical. There's no overhead resistance because nobody's stuck holding bags from a higher price. That's bullish in theory. In practice, it means profit-taking can hit hard because everyone's in the green.
When a stock tags an all-time high on a strong day, the next session either gaps higher with conviction or fades back inside the range. If we open tomorrow at $6700 or above, that's continuation. If we open at $6600, that's a trap.
I don't trade off single-day moves anymore. Lost too much money chasing momentum into closes. But if you're already holding from lower, today's the day you set your stop. I'd put it under $6200 — below the opening gap and far enough to avoid normal noise.
Signal Score Breakdown
84.2 is high. Strong Buy territory. Most signal scores I track from FCS API fall between 40 and 60. Anything above 75 means multiple indicators are aligned — moving averages, RSI, MACD, volume, whatever the model weighs.
Here's what I don't trust about high signal scores: they lag. By the time everything lines up and the score hits 84, the easy money is already made. The move from $4945 to $6200 was the signal. Today's score is the confirmation.
That doesn't mean the signal is wrong. It means you're late if you're just noticing now. If you bought at $5500 based on the trend turning, great. If you're buying at $6700 because the score says Strong Buy, you're chasing.
What Happens Next
Nobody knows. But the probabilities aren't complicated. Either this is a breakout that runs another 10-15% before consolidating, or it's a blowoff top that retraces to $6000 within a week.
The Bollinger middle band at $5516 is your line in the sand. If price falls back to that level, the rally is over. Everything between $5516 and $6700 is noise — profit-taking, reloads, short squeezes, whatever. Below the middle band, the trend flips.
I'd want to see how price reacts at $6700 over the next few sessions. If it consolidates here without giving back more than 3%, that's strength. If it spikes to $6800 tomorrow then dumps to $6400, that's a trap. The pattern matters more than the price. Check FCS API pricing if you want to pull this data yourself and track it live.
Position Sizing at All-Time Highs
If you're entering new here, keep it small. All-time highs are low-conviction setups unless you have a strong fundamental thesis. I don't know what Ciena Corporation does, what sector it's in, or what the macro tailwinds are. The data just says price is moving.
That's enough to trade, but not enough to bet heavy. I'd risk 1-2% of the account max. Stop under $6200. Target depends on how the next few days shape up, but I wouldn't hold through a 10% pullback hoping it comes back. Cut it and wait for the next setup.
The other play is waiting for the pullback. If this runs to $7000 then retraces to $6400, that's a better entry than today. You get confirmation of the breakout, a defined risk level, and a clearer reward structure. Patience pays more than FOMO. More analysis on stock setups if you want to compare how different patterns play out.
Mexico Exchange Liquidity
This isn't NYSE volume. Gaps happen. Slippage happens. If you're trading this, use limit orders and expect wider spreads. I've been filled 2% away from my limit on MX stocks during volatile sessions. It's not fraud, it's just thin books.
That also means stops can get run easier. If the stock drops 6% in 10 minutes, your stop at $6200 might fill at $6150. Plan for that. Don't size positions assuming tight execution because you won't


