

It's sitting at 1.18569, down from the open but somehow still flashing a buy signal. That's the first red flag. A weak buy with low confidence isn't a signal—it's noise.
The Squeeze Before Nothing
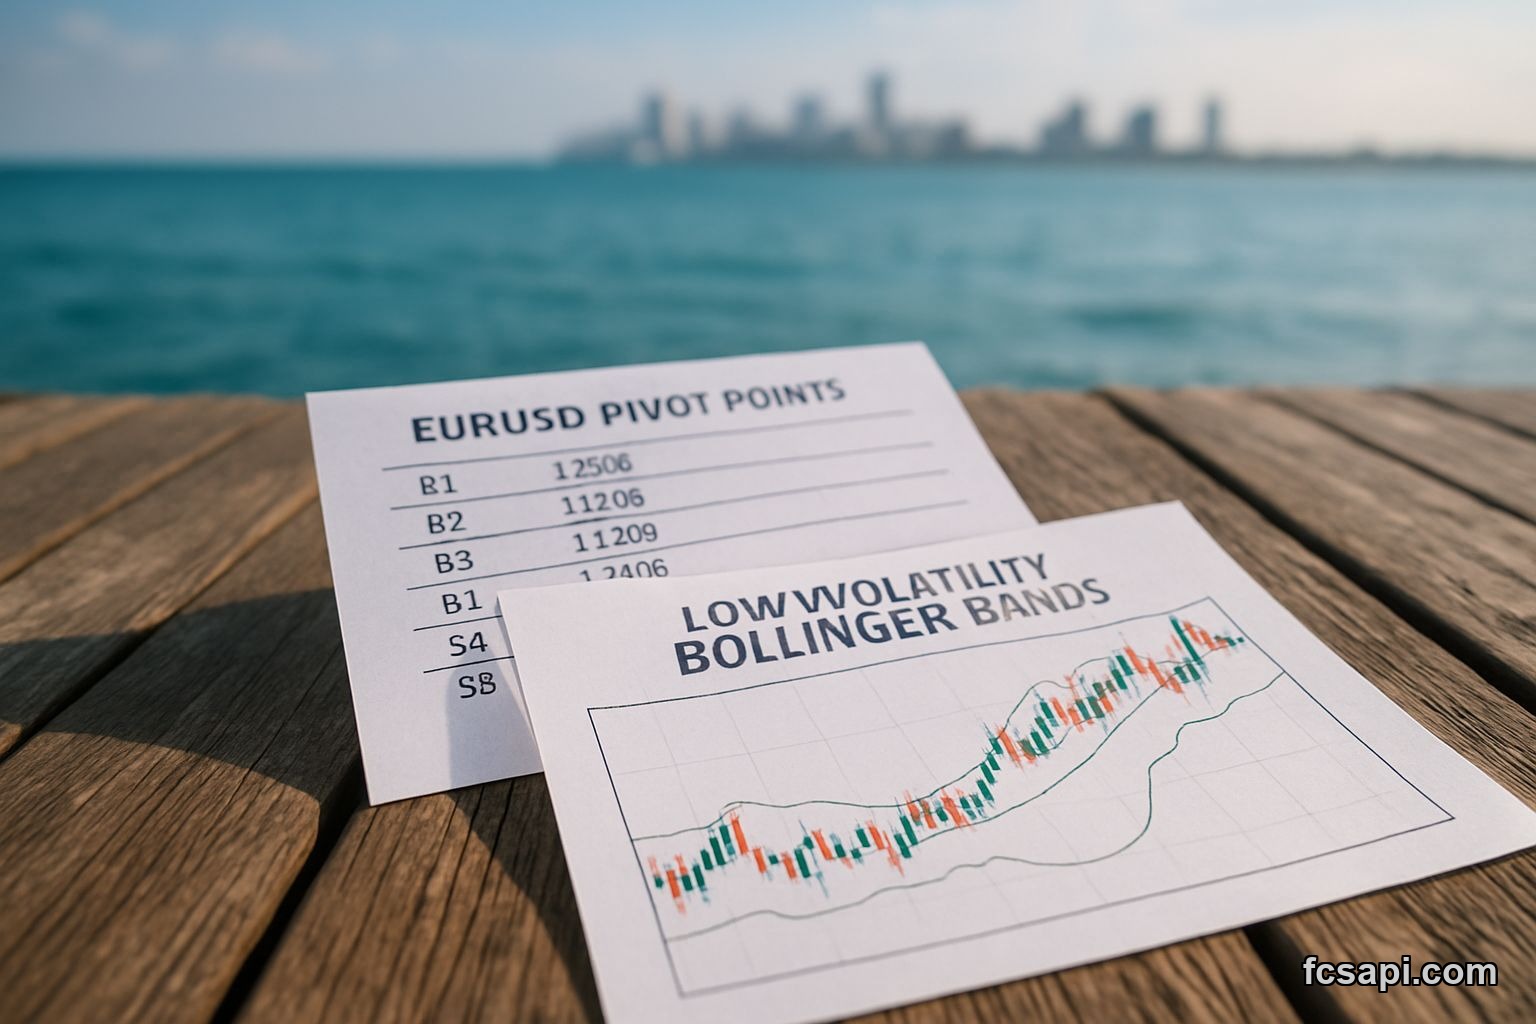
Bollinger Bands show a normal squeeze with price sitting at 56% of the band width. Low volatility confirmed by an ATR of 0.0091. This isn't a coiled spring; it's a market that's forgotten how to move.
The moving averages tell a conflicted story. The 100-day SMA screams strong buy way down at 1.16855. But the 10-day EMA is neutral right here at 1.18568. The long-term trend might be up, but the short-term engine has stalled.
That ADX reading of 31.79 is interesting—technically a strong buy signal for trend strength. But an ADX in the low 30s suggests a trend that’s more wishful thinking than forceful reality.
Pivot Points Are Your Only Friend
Forget the oscillators for a second. The pivots are clear and they're tight.
- Woodie Resistance: 1.18862
- Woodie Support: 1.18485
- Classic Resistance: 1.18858
- Classic Support: 1.18481
The range between support and resistance is about 38 pips. That’s the entire battleground. A break below S1 likely targets last month’s low of 1.15729.
The Performance Lie
It’s up 0.39% over the past week. Big deal. It’s still over two cents below the monthly high of 1.20826.
This is classic consolidation after a failed rally. The data from an FCS API feed shows it clearly: bullish price action trapped inside bearish momentum indicators.
| Indicator | Value | Signal |
|---|---|---|
| SMA (100) | 1.16855 | Strong Buy |
| EMA (10) | 1.18568 | Neutral |
| ATR (14) | 0.0091 | Strong Buy |
| Weekly Perf. | 0.39% | - |
The strong buy on ATR is for volatility expansion, not direction.Forex APIs can give you the numbers, but you have to know which ones to ignore.
The Real Risk for 2026
The risk isn't a crash—it's boredom punctuated by false breaks.Check any converter tool and you'll see this pair hasn't done much lately.
A drift down to test that strong buy level at the hundred-day average seems more likely than a surge to new highs.The setup looks like patience rewarded until it isn't.
The market's telling you it doesn't know what to do next.Do you trust a weak signal in a quiet market?

