
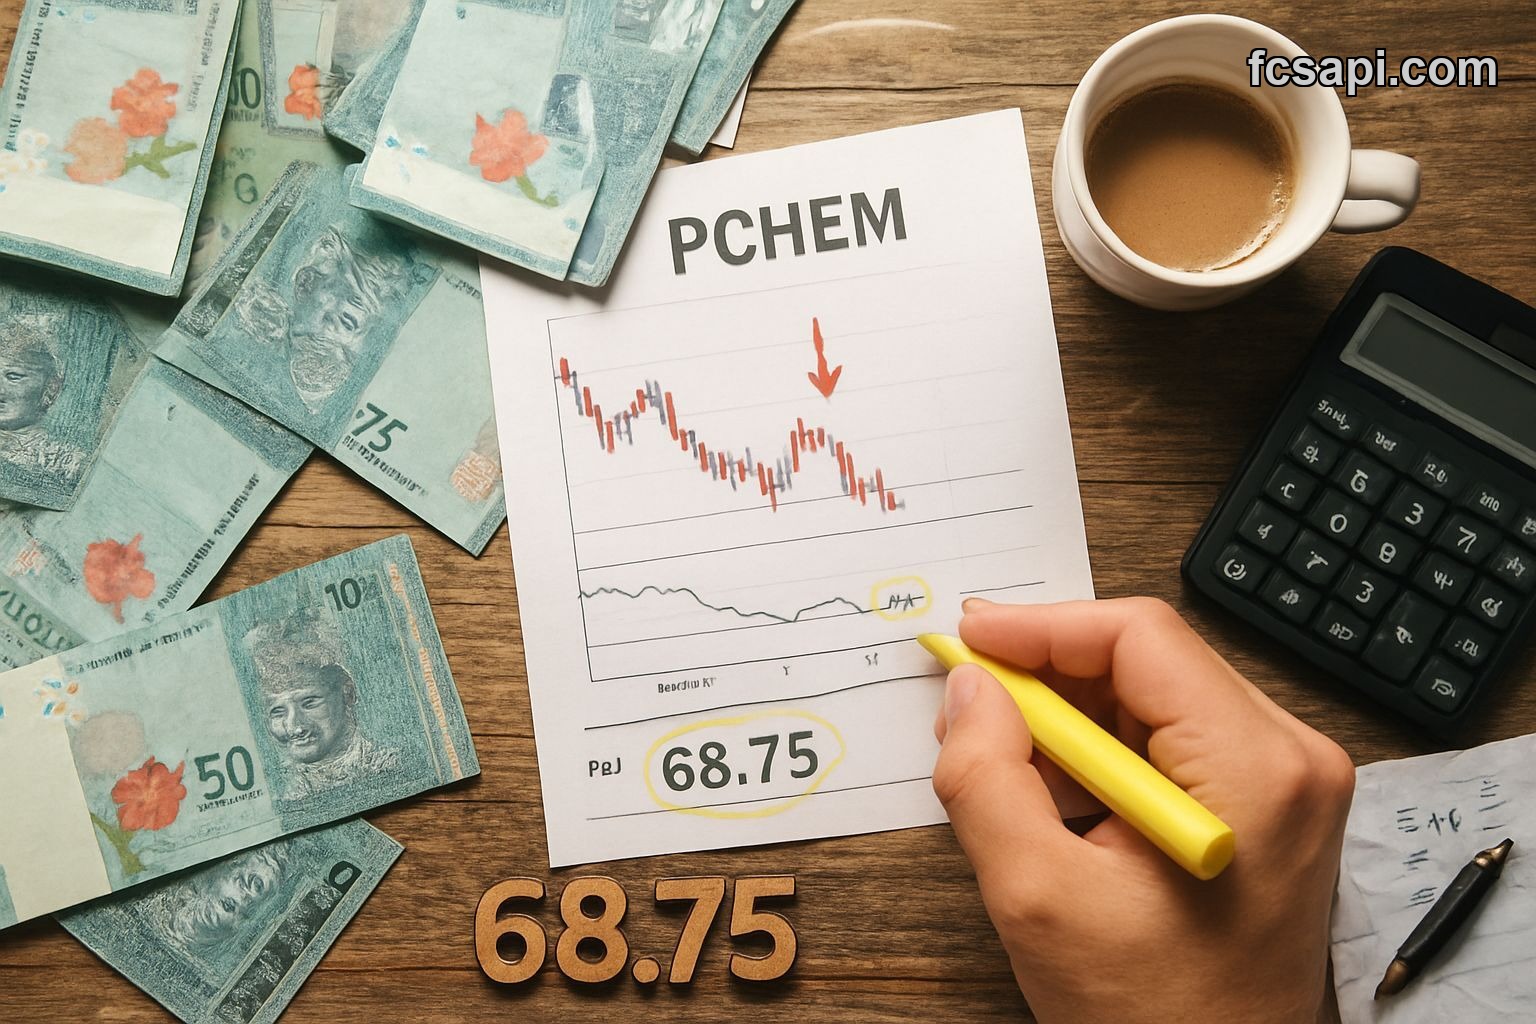
A hammer candle at 4.58 after a 3.58% drop. That's what PETRONAS Chemicals Group Bhd. printed today, and the system's screaming Strong Buy with high confidence. But RSI's at 68.75 — that's Sell territory. Something's off here.
I've traded enough hammers to know they don't always work. The pattern looks pretty on a chart, shows up after a decline, suggests buyers stepped in. But context matters. PCHEM opened at 4.75 and sold off hard. The hammer formed near 4.61 support, bounced to close at 4.58. Classic setup. Except the price is still down for the day and RSI's screaming overbought.
The Signal Conflict Nobody's Talking About
MACD Level sits at 0.3178 — Strong Buy. All the moving averages agree. EMA 200 at 3.74, SMA 200 at 3.65, SMA 10 at 4.09. Price is trading above every single one. That's textbook bullish. The problem? RSI at 68.75 says this thing's stretched.
I've been burned by this exact setup before. Stock looks great on moving averages, momentum's rolling, then RSI hits 70 and the whole thing unwinds. You buy the breakout and three days later you're down 5%. PCHEM's not at 70 yet, but 68.75 is close enough to worry.
The Ultimate Oscillator reads 56.31 — neutral. Not helping. When you've got MACD screaming buy and RSI flashing warning signs, you want a tiebreaker. 56.31 doesn't pick a side. You're on your own.
What the Volatility Data Actually Tells You
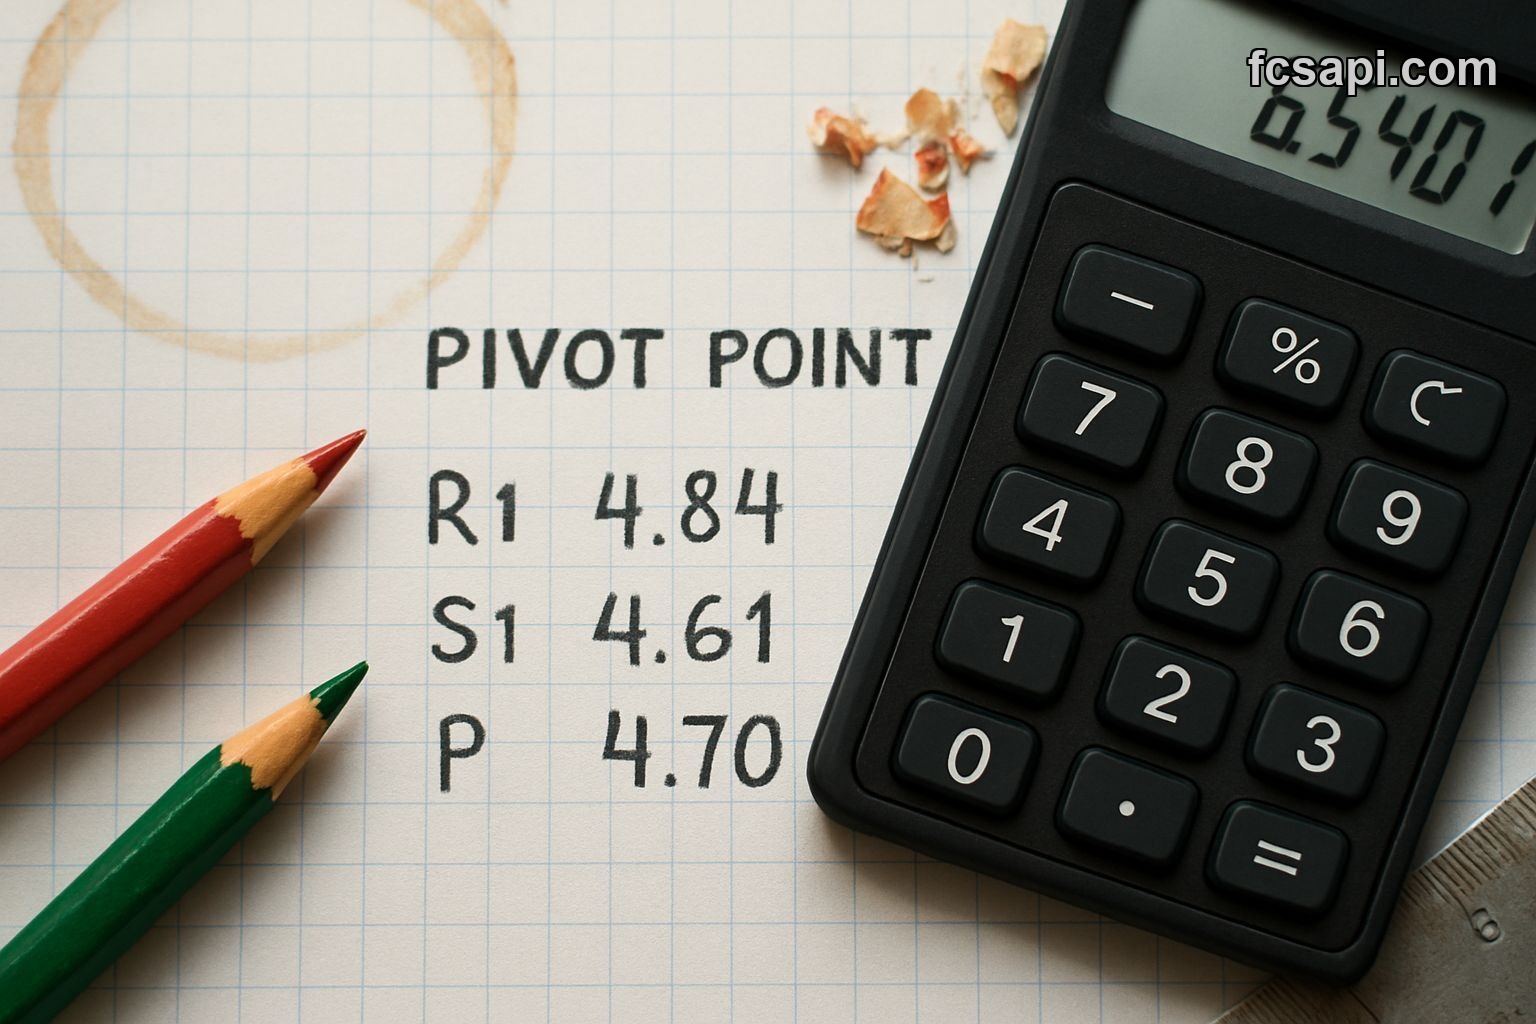
ATR percentage is 6.54. That's high. Really high. This stock moves. Pivot points show resistance at 4.84 (Classic R1) and support at 4.61 (Classic S1). The range is tight but the swings inside it are violent. Woodie pivots aren't much different — R1 at 4.87, S1 at 4.64.
Here's the thing about high volatility in a Strong Buy signal: it cuts both ways. Yeah, you could catch a 5% move up. You could also catch a 5% move down. The hammer suggests buyers showed up today, but they showed up after a 3.58% drop. They didn't prevent the drop. They just stopped it from getting worse.
The 1-month low is 3.00. PCHEM traded at 3 bucks four weeks ago and now it's at 4.58. That's a 52% move in a month. When a stock runs that hard that fast, hammers start looking less like reversal signals and more like profit-taking pauses. The all-time high is 11.08. We're nowhere near that. But we're also up 52% in a month with RSI pushing 70.
Six-Month Performance Context
6-month return is 5.53%. Not much. Actually kind of weak for a Strong Buy. If this stock's been grinding sideways for half a year and then suddenly rips 52% in four weeks, that's not steady growth. That's a surge. Surges reverse. I'm not saying PCHEM's about to collapse, but the risk-reward here is skewed. You're buying near recent highs with RSI elevated and volatility screaming.
The FCS API data through stock API documentation shows all the technical indicators lined up for a buy. I'm not arguing with the system. The moving averages are right — price is above them. MACD's right — momentum's positive. But the RSI warning is real. When 9 out of 10 indicators say buy and 1 says sell, sometimes that 1 is the one that matters.
Why This Setup Breaks Down
Hammers work best at major lows after long declines. PCHEM's 1-month low was 3.00, but the stock's been trending up since. Today's drop from 4.75 to 4.58 is noise, not a trend reversal. The hammer formed in the middle of a short-term pullback within an uptrend. That's not the same as a hammer at a market bottom.
I've watched traders pile into hammers like this and get wrecked. The pattern looks clean, the indicators flash green, you convince yourself it's free money. Then the stock gaps down next session because some analyst downgraded it or earnings missed or oil prices dropped or whatever. High-volatility stocks don't care about your hammer candle.
Check out API pricing plans if you're pulling PCHEM data yourself. But pulling data's not the same as knowing what to do with it. A Strong Buy signal with 68.75 RSI and 6.54% ATR is a coin flip. Maybe it works. Maybe it doesn't. The edge isn't big enough.
The Real Risk Here
Resistance sits at 4.84. That's 5.7% upside from here. Support's at 4.61, which is 0.7% downside. But that support calculation assumes today's low holds. If PCHEM breaks 4.61, next stop is probably 4.35 based on the moving averages. That's a 5% drop. So your upside's 5.7%, your downside's 5%, and you're entering with RSI near overbought. Not great.
The all-time high at 11.08 is irrelevant right now. We're not in a bull market for PCHEM — we're in a month-long spike off a 3.00 low. The 6-month performance at 5.53% tells you this spike is recent and probably overdone. When stocks move 52% in four weeks, they usually give back 10-15% before moving higher. Maybe this one's different. But I wouldn't bet on it.
I'm not saying don't touch PCHEM. I'm saying don't chase it at 4.58 with RSI at 68.75 just because the hammer looks pretty. Wait for a pullback. Wait for RSI to cool off. Or accept you're buying momentum and set a tight stop. If you're checking more stock market articles for confirmation bias, stop. The data's telling you there's risk here. Listen to it.
Would you buy a Strong Buy signal if you knew RSI was about to hit 70 tomorrow?


