
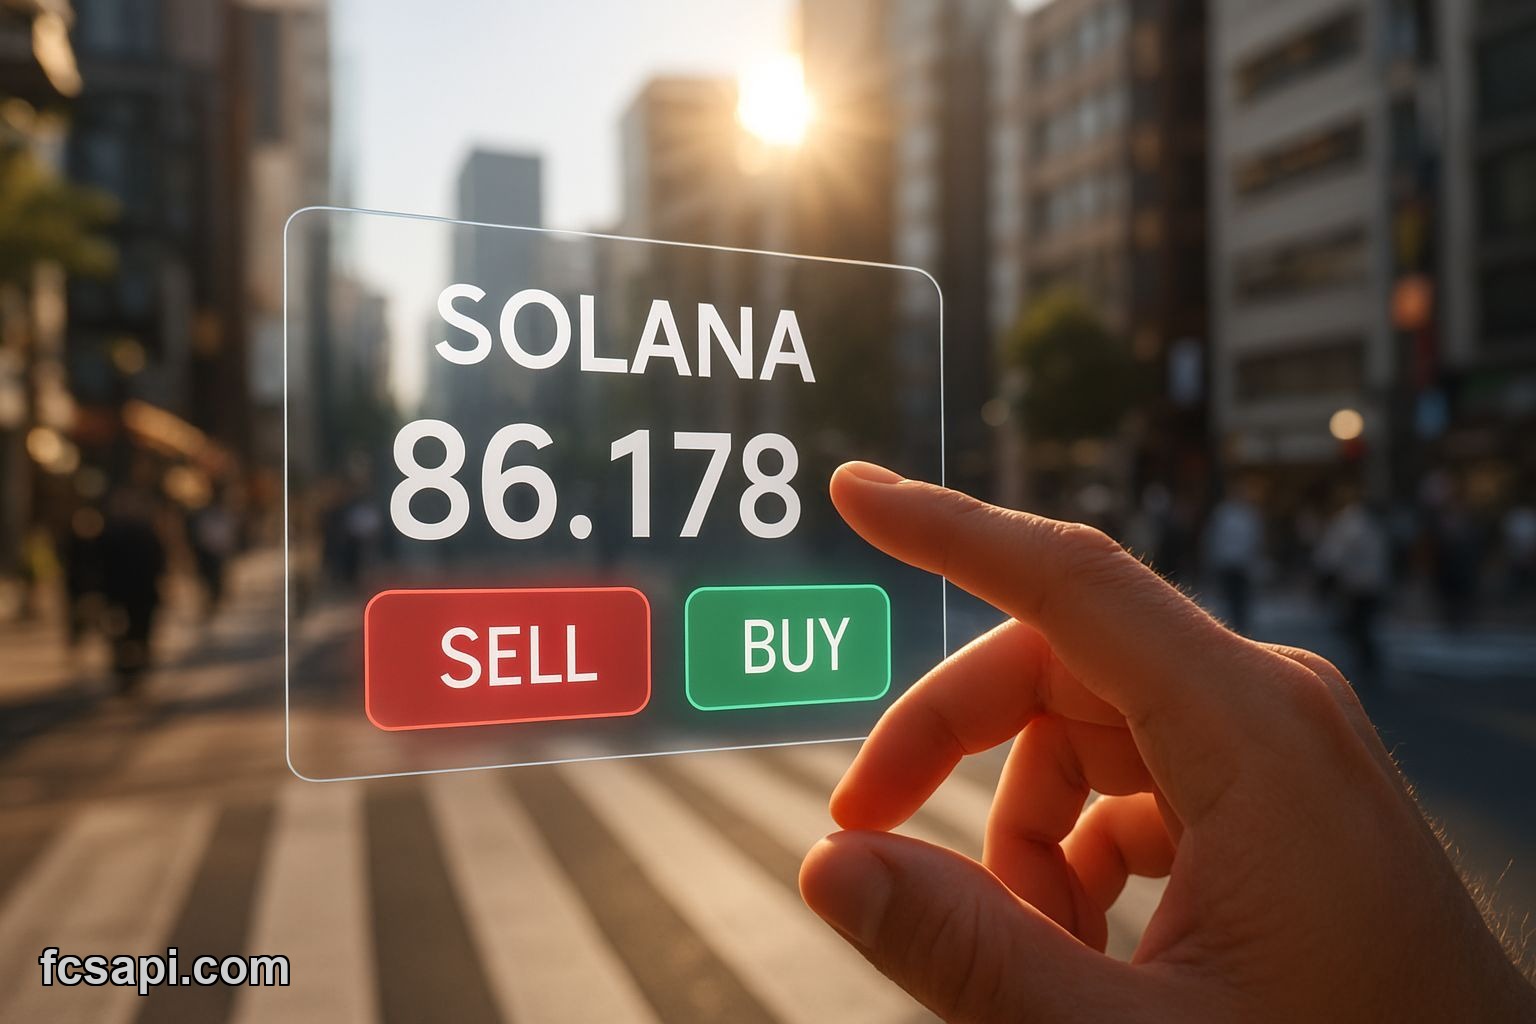
You wake up, check the charts, and Solana is sitting at 86.178 today, February 21, 2026. Seems alright, right? Up a decent 1.816% from open. You might even feel a little bullish.
But then the signal blares "Sell." A full-blown "Sell" signal, actually, with a Confidence reading that's only Medium and a Signal Score of -35.6. So, we've got a rising price on the day, but the system says ditch it. Talk about a headache.
The Bullish Price, Bearish Signal Contradiction
This is what drives traders crazy. The asset is showing positive price action, a nice bump from the opening bell. You see it, you feel it.
Then some complex algorithm spits out a hard "Sell." Which one do you trust? Your gut, riding the momentary wave, or the cold, calculated data telling you to pull the plug? I've seen too many people, myself included, ignore the numbers because of a good feeling.
Last year, I stuck with a coin that had a weak sell signal but looked strong for a few days. Cost me more than I care to admit. Sometimes the market just needs an excuse to dump, and that sell signal might just be it, regardless of short-term price gains.
Moving Averages: A Sea of Confusion
If you thought the overall signal was messy, wait until you dive into the moving averages. It’s like they’re all shouting different things at the same time.
Look at this:
- SMA 10: 84.3082 (Strong Buy)
- SMA 25: 91.7005 (Strong Sell)
- EMA 100: 123.449 (Strong Sell)
So, the short-term average screams "buy," but the medium and longer-term ones are screaming "sell, sell, sell." That SMA 10, trading below the current price of 86.178, offers some immediate support. But then you look at that 100-period Exponential Moving Average, far, far above current prices, and it paints a picture of a serious long-term downtrend.
This tells me that any bullish momentum is super short-lived and probably just a blip in a bigger, darker trend. You can't just ignore the larger averages. Those longer-term indicators have sunk me more times than I can count. A lot of retail folks just glance at the shortest SMA and think they’re golden.
Oscillators Tell a Story, Sort Of
Okay, so moving averages are giving us a mixed message, leaning bearish longer term. What about the oscillators?
We've got the Stochastic K% at 61.3179, which signals "Buy." That's nice, a little bit of confirmation for the short-term bullishness. It suggests some underlying buying pressure or momentum is there.
But then the Ultimate Oscillator comes in, sitting at 52.4048, and calls it "Neutral." Not bad, not good. Just… there. So one says "buy," another says "meh." It’s like your two best friends giving you conflicting advice on a bad dating prospect.
They’re not pushing us decisively one way or the other, which often makes things even more frustrating. If everyone agreed, life would be easy. But then where’s the edge?
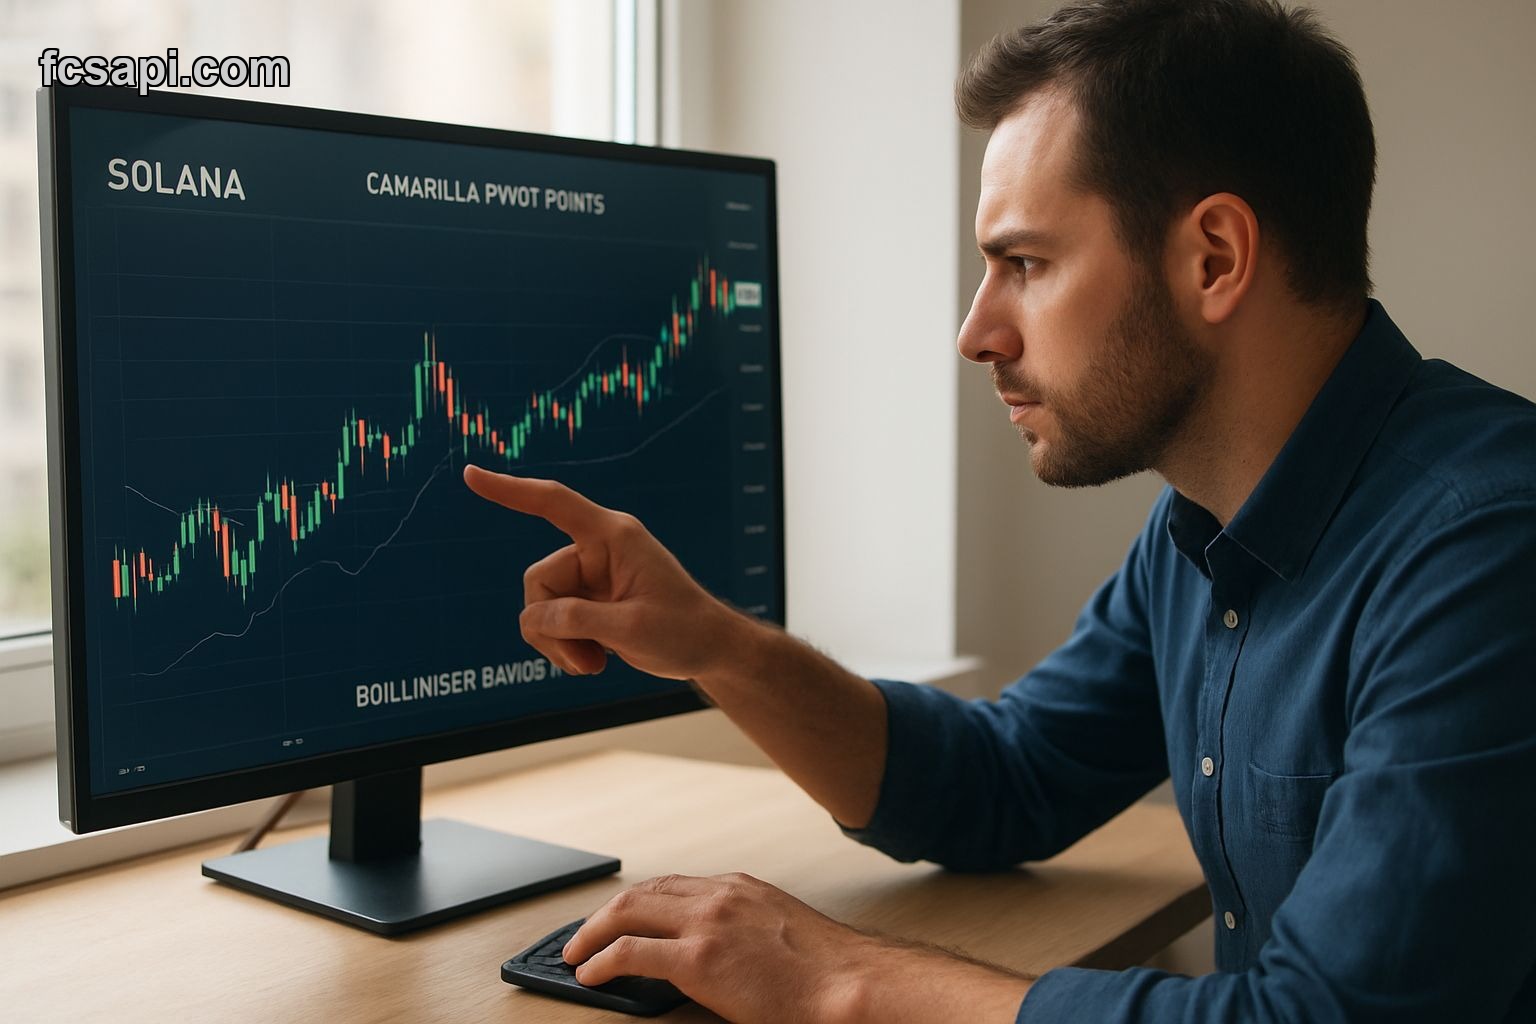
Pivot Points and Bands: Pinpointing the Next Move
Now, let's talk about the more structural elements. Pivot points, especially Camarilla, are crucial for figuring out potential support and resistance levels. You need to know where things might bounce, or where they might crash through.
For Solana today, the Camarilla Pivot is at 84.634. We’re trading above that, which is good for the bulls in the very short term. But the resistance levels aren't far off. R1 sits at 84.9706. That's a tiny window. Break through that, and we'd be looking for the next hurdle. But we're already above R1. That actually shows strength, but also signals potential exhaustion quickly.
Then there are the Bollinger Bands. The Middle Band is up at 91.7005. Solana's current price of 86.178 is below that middle line. This usually implies a bearish sentiment or potential for further decline towards the lower band. It indicates the price is below its short-term average, which aligns with the "Sell" signal.
The position is at 43.09%, and the squeeze is "Normal." A normal squeeze usually means volatility isn't collapsing, but it's not exploding either. This means we're probably not looking at a massive, immediate breakout or breakdown. Still, being below that middle band, coupled with a dominant "Sell" signal, it just keeps pointing one way for "Solana forecast 2026."
Performance Reality Check: A Glimmer in the Long Shadow
Alright, let's talk real performance. Not just today's price action, but the bigger picture. Because if you’re only looking at one day, you’re playing a different game entirely.
Check these numbers:
- 6-Month Performance: -58.1169%
- 1-Week Performance: +2.32103%
This is where it gets interesting. That -58.1169% over six months is brutal. Absolutely brutal. Anyone who got in six months ago is down big time. That's a serious long-term bearish trend. A very strong reason for the EMA 100 to be giving a "Strong Sell" signal, wouldn't you say? Our crypto API captures these long-term trends alongside real-time data.
But then you see the +2.32103% for the last week, and today's small gain of about one-point-eight-percent, and you think, "Ah, maybe a turnaround?" This is where the short-term noise can really trick you. It’s a small, small bounce in a truly massive downtrend from its all-time high of 295.11.
Anyone looking for a "Solana prediction" needs to understand this context. It's like finding a dollar on the ground after you just lost a hundred. Nice, but still a net loss. This recent bullishness is barely a blip compared to the long-term pain. The journey from 295.11 to 86.178 is a steep, painful slide.
My Take: Solana Buy or Sell Today?
Given everything, what's the actual play for "Solana price today"? Honestly, I'm leaning heavily bearish. The overall signal says "Sell," the longer-term moving averages are flashing "Strong Sell," and even with the short-term price increase, the context of the last six months is grim.
Sure, the short-term SMA 10 is a "Strong Buy," and the Stochastic K% also points to a buy. But that's two "buys" against three "strong sells" from the averages alone, plus the main signal shouting "sell." This isn't a tight call. This is a trap.
The "Solana analysis" points to a classic dead cat bounce situation. People see a slight uptick after a huge decline and pile in, hoping for a reversal. But without stronger, broader conviction, that 1.8% gain for the day looks like a quick pop, easily reversed. It just isn't enough to overcome the entrenched bearishness seen across most major indicators. Reliable crypto data, like the kind FCS API provides, helps cut through this noise.
For me, on February 21, 2026, the risk here far outweighs the potential reward. The medium-confidence "Sell" signal isn't something to ignore when you have so much conflicting data but a clear long-term downtrend. Avoid trying to catch a falling knife, even if it has a shiny, momentarily ascending blade.
Solana will likely test lower support levels again soon, despite today's positive price action.

